The Reporting API is a Cube-based REST API that enables developers to query sales, payments, customer, and catalog metrics for embedding analytics, operational automations, and back-office workflows. Unlike traditional REST APIs with dozens of fixed endpoints, the Reporting API exposes only two universal endpoints:
/v1/meta— Describes what data is available (schema discovery)/v1/load— Queries the actual data based on discovered metadata
This design enables a powerful, flexible API surface that can evolve without breaking client applications that properly implement schema discovery.
- Expansive data catalog: Access hundreds of measures and dimensions without endpoint proliferation
- Automatic joins: Combine measures from multiple cubes in a single query—the API handles joins automatically
- Future-proof clients: Applications that discover schema at runtime adapt automatically to new fields
- Consistent API: One query pattern works for all reporting needs
- More complex client logic: You must implement schema discovery and dynamic query building
- Runtime validation required: Invalid query combinations are caught at query time, not compile time
- Learning curve: Developers must understand Cube concepts (cubes, measures, dimensions, segments)
| Traditional REST API | Reporting API (Dynamic Schema) |
|---|---|
| Fixed endpoints per resource | Two universal endpoints for all queries |
| Fields are predetermined | Fields discovered via metadata |
| Schema changes require API versioning | Schema evolves; clients adapt via discovery |
| Simple to use, limited flexibility | Complex setup, maximum flexibility |
| Client knows structure at build time | Client learns structure at runtime |
A view is a curated, pre-joined interface built on top of one or more cubes. For example, the Sales view combines data from multiple cubes and pre-filters for common sales reporting. Views are the recommended starting point — they provide a simpler query surface with sensible defaults. Use cubes directly when you need cross-cube joins or access to raw data not exposed through a view.
A cube is a logical grouping of related measures and dimensions (e.g., Orders, PaymentAndRefunds). Think of a cube as a "data table" optimized for analytics. You can query cubes directly for advanced use cases, but prefer views for standard reporting.
Measures are numeric aggregations you want to calculate (e.g., Orders.net_sales, Orders.tips_amount). These are the "what you're measuring" in your query.
Dimensions are attributes you use to group or filter data (e.g., Orders.location_id, Orders.sale_timestamp). These are the "how you're slicing" your measures.
Segments are predefined filters that represent common business logic (e.g., Orders.closed_checks filters to fully paid orders). Use segments to ensure report parity with Square's dashboard.
Time dimensions are special dimensions for time-series queries. They support granularity (day, week, month) and date ranges.
Every interaction with the Reporting API follows this pattern:
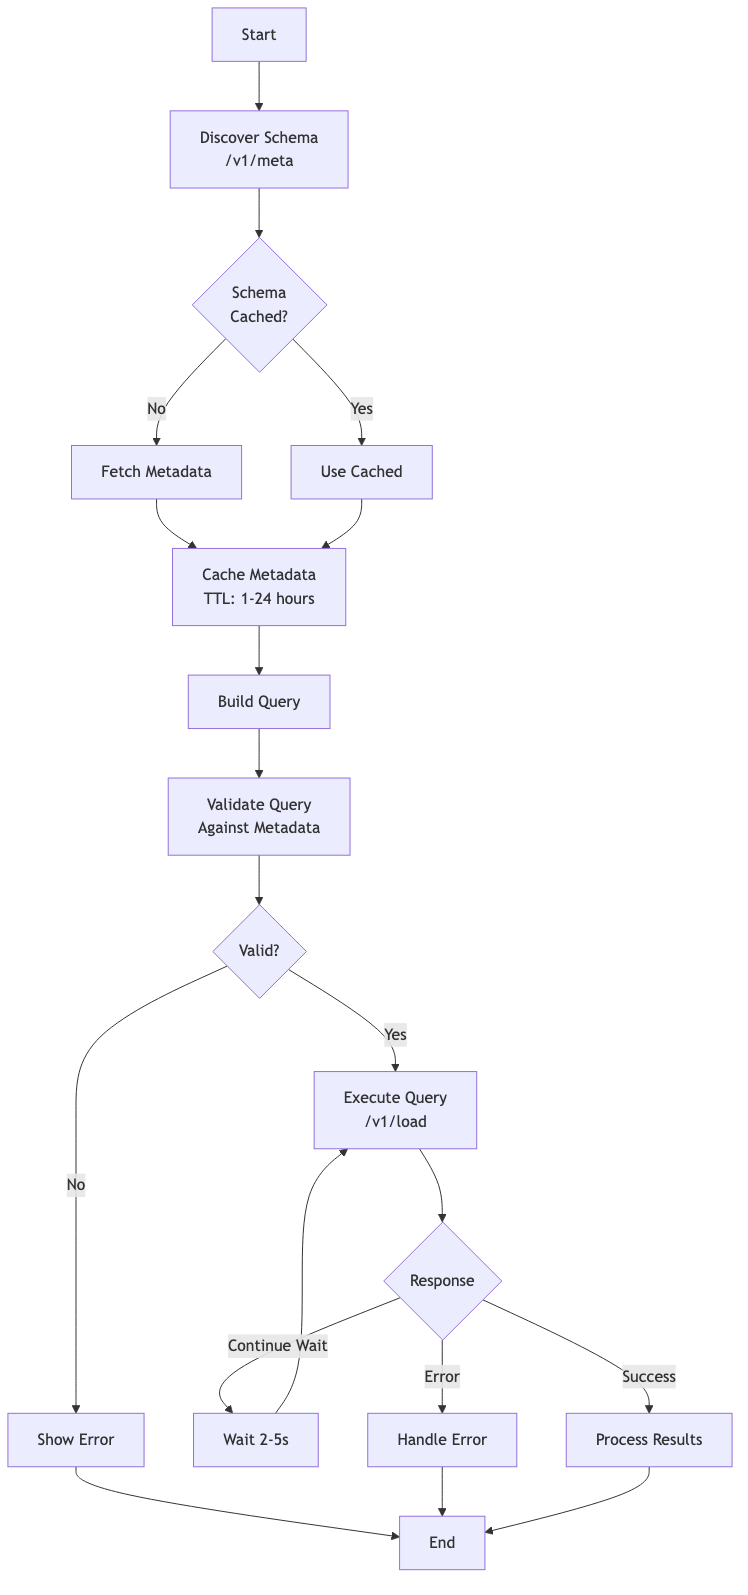
Workflow Steps:
- Discover: Call
/v1/metato learn available cubes, measures, dimensions, and segments - Cache: Store metadata with appropriate TTL (1-24 hours)
- Validate: Check that your desired measures and dimensions are compatible
- Execute: Send a query to
/v1/loadwith your selected entities - Handle Long-Running Queries: Retry if you receive a "Continue wait" response
- Process: Parse and use the returned data
One of the most powerful features of the Reporting API is the ability to combine data from multiple cubes in a single query. Simply include measures from different cubes in your measures array, and the API automatically handles the join.
Example: Combine Orders, Payments, and Items data
{
  "measures": [
    "Orders.net_sales",
    "Orders.count",
    "PaymentAndRefunds.total_amount",
    "ItemTransactions.net_quantity"
  ],
  "dimensions": ["Orders.location_id"],
  "timeDimensions": [{
    "dimension": "Orders.sale_timestamp",
    "dateRange": "last 30 days"
  }],
  "segments": ["Orders.closed_checks"]
}
This single query returns sales, payment totals, and items sold—all grouped by location. No need to specify join conditions; the API handles it automatically.
See Multi-Cube Joins for more multi-cube join examples.
Here's a minimal example showing the complete workflow:
curl -X GET "https://connect.squareup.com/reporting/v1/meta" \
  -H "Authorization: Bearer YOUR_ACCESS_TOKEN"
This returns metadata describing all available cubes, measures, and dimensions.
curl -X POST "https://connect.squareup.com/reporting/v1/load" \
  -H "Authorization: Bearer YOUR_ACCESS_TOKEN" \
  -H "Content-Type: application/json" \
  -d '{
    "query": {
      "measures": ["Orders.net_sales", "Orders.net_sales_with_tax"],
      "timeDimensions": [{
        "dimension": "Orders.sale_timestamp",
        "dateRange": ["2024-01-01", "2024-01-31"],
        "granularity": "day"
      }],
      "segments": ["Orders.closed_checks"]
    }
  }'
This returns daily net sales for January 2024, filtered to closed (completed) orders.
The Reporting API is ideal for:
- Custom dashboards and analytics: Build seller-facing or internal reporting tools
- Operational automations: Trigger workflows based on sales thresholds or patterns
- Back-office integrations: Sync sales data to accounting, inventory, or ERP systems
- Ad-hoc analysis: Query arbitrary combinations of metrics and dimensions
Not recommended for:
- Real-time transaction processing (use the Orders or Payments APIs instead)
- Operational CRUD operations (use domain-specific APIs)
- High-frequency polling (data freshness is ~15 minutes for most cubes)
The Reporting API supports both personal access tokens and OAuth tokens.
For OAuth applications, request the REPORTING_READ permission scope when obtaining authorization from sellers.
For testing and development, you can use personal access tokens from the Developer Console.
Include your access token in the Authorization header on every request:
Authorization: Bearer YOUR_ACCESS_TOKEN
See Getting Started for detailed authentication setup and OAuth API documentation for implementing OAuth flows.
- Standard cubes (e.g.,
Orders): ~15 minute refresh interval
All Reporting API endpoints are under:
https://connect.squareup.com/reporting
Core endpoints:
GET /v1/meta— Schema discoveryGET/POST /v1/load— Execute queries
- Schema Explorer — Browse all cubes, measures, and dimensions interactively
- Meta tag reference — Browse all fields returned from the metadata response
- Cube Query Format — Complete query property reference
- Error Handling — Handle errors and edge cases
- Best Practices — Production-ready patterns