The Sales Report sample application summarizes all the items sold and provides sales data for each item sold, such as:
A description of the item.
The number of items sold.
The total sales amount for the item.
The inventory on hand for the item.
The Python sample application also includes a test data seeding script that uploads sample catalog items and customers to your Square account in the Sandbox environment. The script generates orders, payments, and inventory counts based on the uploaded data.
This scenario shows how to download, install, and run the sample. The second part of the scenario provides a detailed look at the Python code in the application.
Link to section
What you'll learn
By the end of this scenario, you'll know:
How to filter orders by time period and completion status.
How to retrieve product catalog data for items that have been purchased.
How to determine the current inventory for an item.
How to batch a set of customer creation requests into a single API call.
How to batch a set of catalog object creation requests using a single API call.
How to batch a set of inventory change requests into a single API call.
Link to section
Prerequisites
The prerequisites for running the test data seeding script and sales reporting script in the Sandbox environment are minimal, while running the Sales Report application in production imposes normal production prerequisites.
Before you begin, you'll need to do the following:
Install Python. Square supports Python version 3.7 and later.
The Sales Report application is available at https://github.com/Square-Developers/python-sales-report-sample. To download the application, choose Code and then choose Download ZIP. When the download is complete, expand the .zip file and follow the installation instructions in the readme.md file.
To configure the application, create a new file named .env by copying the contents of the provided .env.example file. In the new .env file, make the following changes:
Calls CreateOrder to generate an order for each catalog item.
Important
The seeding script creates catalog items, orders, payments, and customers in the Square account that you provided an access token for. Be sure that the token you provided is a Sandbox access token.
You're now ready to run the sales reporting script. You can provide a start date and end date for the report. If you don't provide date parameters, today's date is used for the report's order completion date range. If you do provide dates, they need to be in RFC-3339 format.
To see a usage summary, run the following command:
python ./simple-sales-report.py --help
The output looks like the following:
usage: simple-sales-report.py [-h][--start-date START_DATE][--end-date END_DATE]
Generate a sales report for a time period
options:
-h, --help show this help message and exit
--start-date START_DATE
Start datefor the report, in RFC 3339format
--end-date END_DATE End datefor the report, in RFC 3339format
Suppose that the current date is 2024-01-18 and you want a report showing sales data for the previous three months. You can run the following command to generate this report:
Be sure that you set the --start-date and --end-date parameters to include the date that you ran the seeding script. If the script date isn't in the parameter range, the report script returns an empty report.
The program generates the date range you specified and then shows all the completed orders between the two dates. Next, the program generates the sales report.
Order ID - The ID of the order where the item was sold.
Name - The name of the item sold.
Variation Name - The name of the item variation sold.
Qty Sold - How many items were sold on the order.
Order Sales Total - The order price x QtySold total.
Currency - The currency of the money used for the payment.
Qty Remaining - The number of items still in inventory.
The last line of the report shows the grand total sales during the time period.
The report output is also written to a .csv file (sales_report.csv) and saved in the root folder of the project. Each time you run the report, the previous .csv file is overwritten.
When you've finished running the report, you can remove the test data. To do this, run the following command:
python ./seed-data.py --clear
Link to section
How the application works
The application takes a start date and end date for the report. It retrieves only the orders that were fully paid and completed between these two dates. If you don't provide a start and end date, today's date is used.
Each order is represented by an Order object. Within each Order object, there's an array of OrderLineItem objects that comprise the order. Each entry in the array contains basic data (such as name, quantity, and price) about one item. The Sales Report application keeps a running tally of item details and uses this tally to generate the final sales report at the end of the program.
If an item appears in the seller's catalog, it has a catalog_object_id associated with it. The application uses this ID to retrieve a CatalogItemVariation with further details about the item.
Did you know?
An item represents a particular product or service, while an item variation is a set of options for the item. For example, a Coffee item might have several variations available, such as Small, Medium, or Large.
A CatalogItemVariation object contains several fields that aren't visible in the Order, such as its stock-keeping unit identifier (sku) and unit price (price_money). As the Sales Report application runs, it adds these details to the item tally. It also accumulates the total number of each item variation sold during the specified time period, so that these totals appear on the report.
If an item has inventory tracking enabled, the application retrieves the current quantity remaining for the item and adds it to the tally.
When all the data has been gathered, the application generates the results. Each item from the tally is listed, along with a summary of the money received during the time period.
Link to section
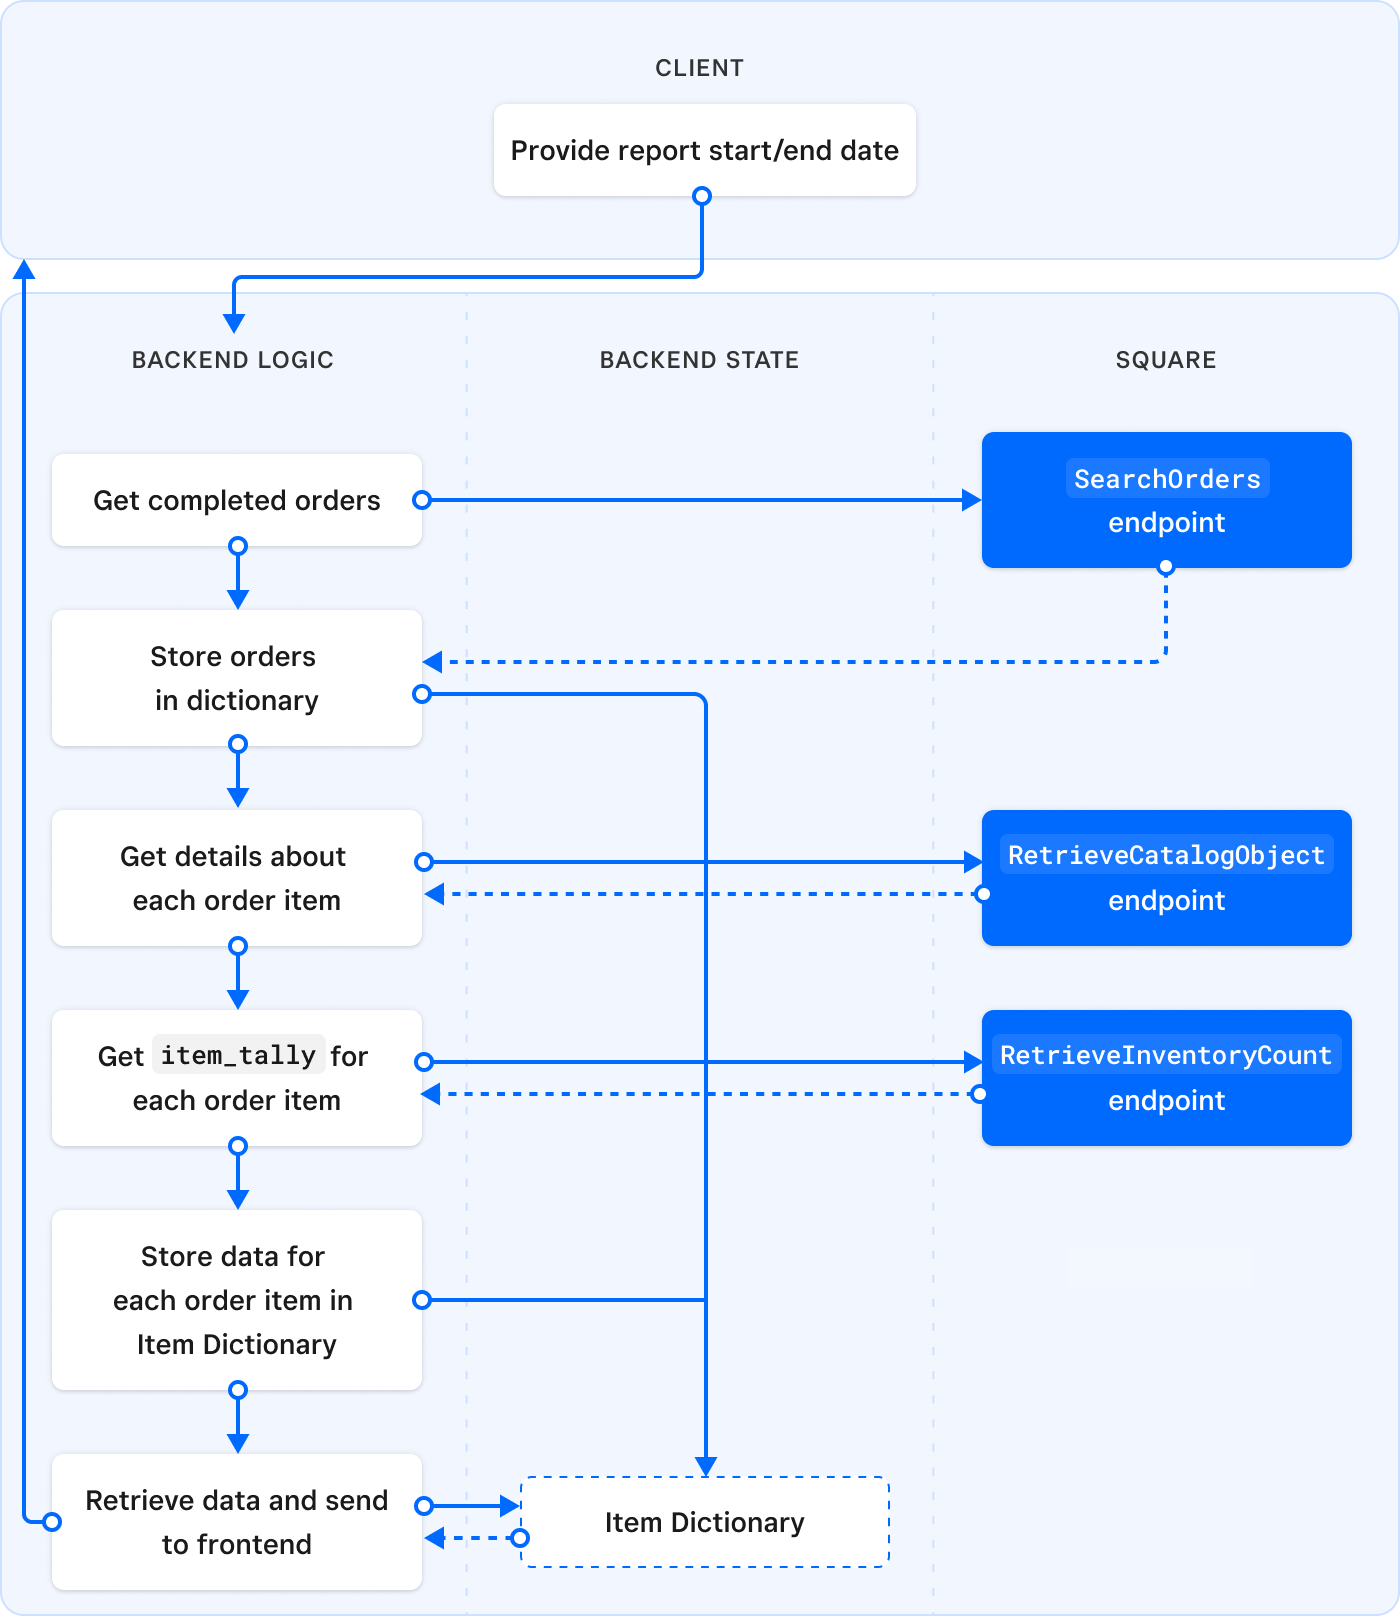
Application call flow
The following sections present call flow details in the order that the application calls the Square API. The flow starts when you run the simple-sales-report.py script.
The program creates and maintains a Python dictionary named item_tally. As it runs, the program adds objects to item_tally that represent the output of the sales report and captures sales data for that item. When all the data has been retrieved, the program iterates through item_tally and generates each item's data.
The program calls SearchOrders to retrieve all the completed orders for the specified time period. By default, SearchOrders retrieves all the orders for that location, so these filters are used to narrow the results:
state_filter - Orders that have been COMPLETED.
date_time_filter - Orders that were COMPLETED between the two dates.
source_filter - Orders that were created by the seeding script.
limit =25# max number of orders per page
result = client.orders.search_orders(
body={"location_ids":[location_id],"limit": limit,"query":{"filter":{"source_filter":{"source_names":[SEED_DATA_REFERENCE_ID]},"state_filter":{"states":["COMPLETED"]},"date_time_filter":{"closed_at":{"start_at": start_date,"end_at": end_date}},},"sort":{"sort_field":"CLOSED_AT"},},})
The SearchOrders endpoint supports pagination, so that programs can retrieve one page of orders at a time. The limit variable is hard-coded at 25, but you can change it to a different value if needed.
The report logic processes the first set of results. If a cursor is returned with the result set, it's used in subsequent calls to SearchOrders. The endpoint is called to retrieve a page of results until there are no more result pages.
Each order has a line_items array containing OrderLineItem objects with basic data about each item in the order. The program captures this data in the item_tally dictionary and uses the Catalog API to get details about each item. For more information, see Retrieve catalog data.
The program continues to retrieve orders, page by page, until there are no more orders that match the SearchOrders filtering criteria.
For each item in an order, the program stores the associated catalog item ID in a list. When the catalog IDs from all order line items are collected, the program calls BatchRetrieveCatalogObjects to get more details about the items in the ID list.
result = client.catalog.batch_retrieve_catalog_objects(body={"object_ids": item_ids})
The resulting CatalogItemVariation objects contain further information about the items, including price_money and sku. These fields are captured in the item_tally dictionary, so that they can appear on the final sales report.
If the track_inventory attribute of a CatalogItemVariation is set to true, Square keeps track of changes to those variation's inventory. In the seed-data-catalog.json file (used by the seed-data.py script), inventory tracking is enabled for each item variation.
result = client.inventory.batch_retrieve_inventory_counts(
body={"catalog_object_ids": item_ids})
The current item count is saved in the item_tally.
When all the orders have been processed and all the item data has been saved to item_tally, it's time to generate the sales report.
First, the report header is printed. This consists of the start date and end date, along with the column headings. Next, the program loops through item_tally and prints the details for each item. Finally, the grand total is printed.
Link to section
Next steps
This scenario shows you how to use the Orders, Catalog, and Inventory APIs to build a simple sales report. You can use the code as is or modify it to suit your needs.
The sample uses read operations on these APIs to get data. You should explore their full capability by reading the following topics: