Measure, measure, measure
A journey about how to measure build times for Android
How long does it take to implement new features? This is an important metric when it comes to improving the effectiveness of software engineers and will give the company an advantage over its competitors. There are many dimensions to consider, such as API boundaries, CI times, IDE responsiveness, deployment speed, and build times, among others. One has to measure all of these aspects in order to improve this metric as a whole, with the realization that some of them are easier to capture while others require more thought.
Measure build times
Measuring build times can be more challenging than one would assume. In real world usage, we rely on Gradle build scans on Android. However, these numbers don’t help identify regressions and improvements in tooling upgrades, and reported developer build times always lag behind after making a change. They only show a trend over time and significant changes are hard to detect until all developers pick them up. Degraded network speeds, other applications running on developer machines, thermal throttling, and many other reasons skew the reported build times.
Build time benckmarks
Instead of relying on build scans alone, we decided to create build time benchmarks for our Android applications to measure whether we make progress into the right direction. These benchmarks are optimized for reproducible and reliable numbers, e.g. we run builds in offline mode and use a prefetched artifact cache. They don’t necessarily represent the developer experience, but they also don’t need to - we have build scans for that. We use the Gradle Profiler to warm up the Gradle daemon for 4 rounds and then capture 7 measured runs. The Gradle Profiler allows us to apply incremental changes to Kotlin and Java files between runs to simulate what a developer might do locally. A typical scenario looks like this:
incremental_build_abi_change_in_account_module {
    tasks = [":module:app:assembleDebug"]

    apply-abi-change-to = "path/to/file/Java.java"
    apply-abi-change-to = "path/to/file/Kotlin.kt"

    show-build-cache-size = true
    warm-ups = 4
    gradle-args = ["--offline", "--no-build-cache"]
}
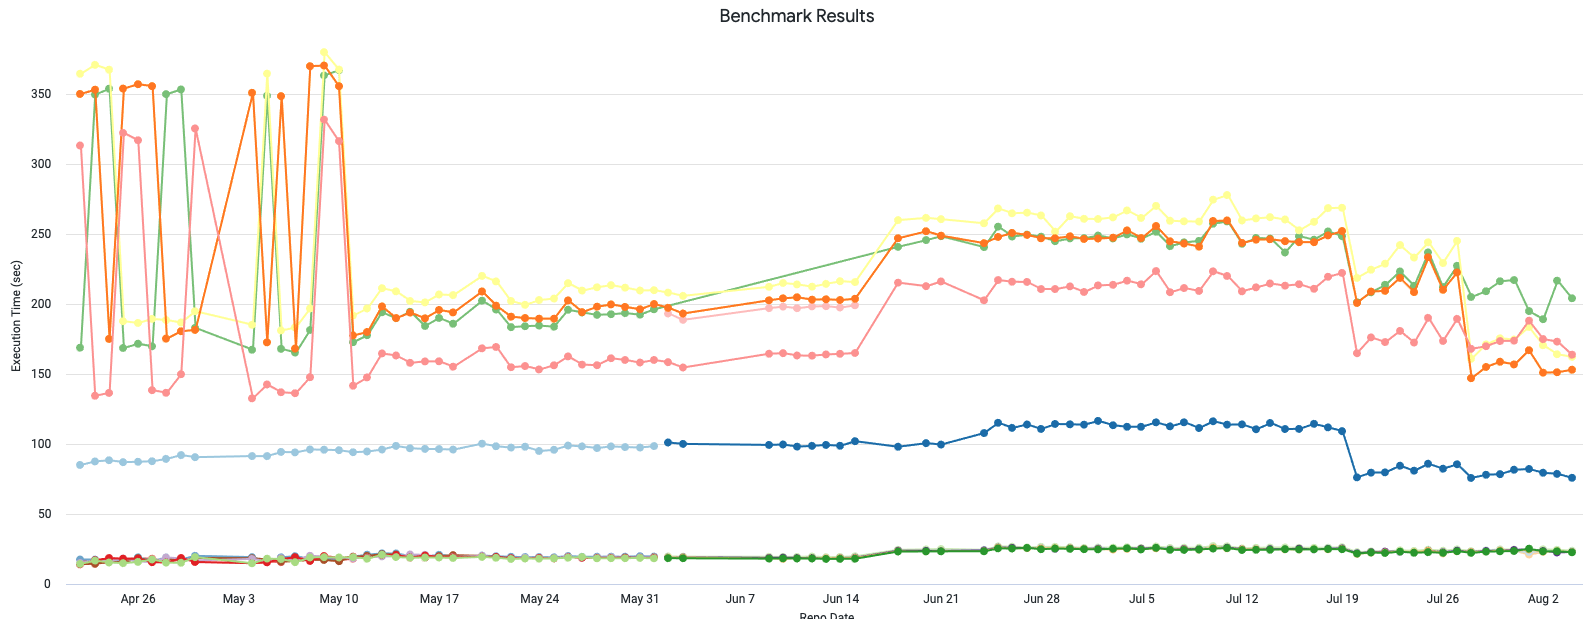
Initially, we ran those benchmarks manually once a month to measure different strategies in our development approach. But this wasn’t good enough for new use cases, such as catching tooling regressions. Since then we’ve setup a pipeline that runs the benchmarks daily on an EC2 instance and reports the benchmark results into our data backend. Our dashboard is updated every day and shows the individual benchmarks:

Since we set up the dashboard there have been improvements but also regressions that we captured.
- On May 11th we rolled out the Android Gradle Plugin version 4.2. It fixed a bug in version 4.1 causing randomly long build times.
- On June 18th, we converted our buildSrc directory to an included build, which caused a build time regression of 30%. Without the dashboard we likely wouldn’t have noticed, because on paper this seemed to be the better strategy.
- On July 20 we fixed the regression caused by the included build.
- On July 28 we adopted Gradle 7.1 and made further improvements to our Gradle plugins.
Developer machine evaluation
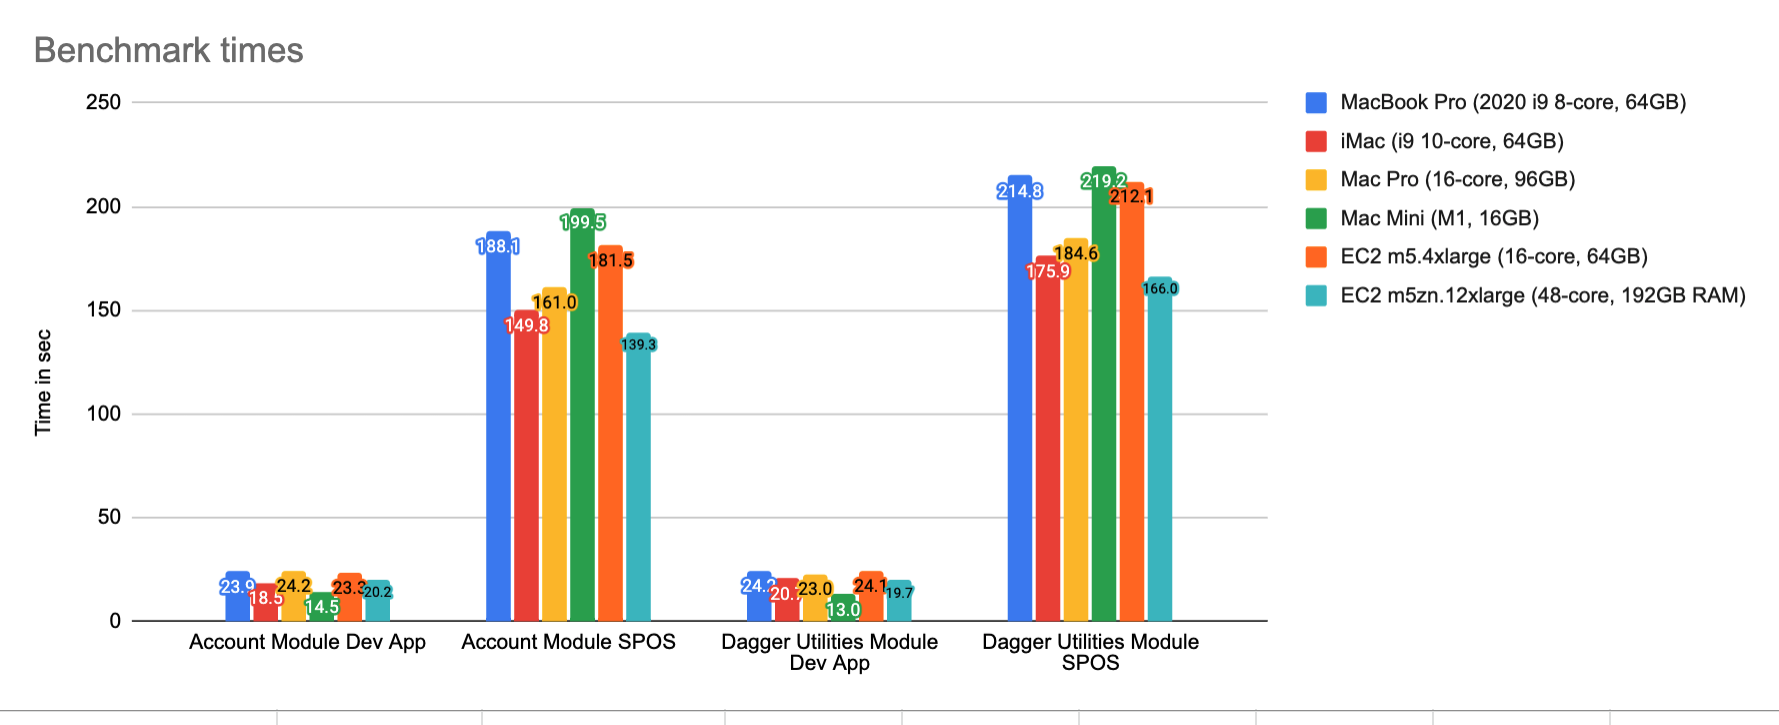
Having these consistent build time benchmarks not only helped us for use cases mentioned above, but also allowed us to easily evaluate the best workstation for our mobile developers and compare them fairly. We’re running into bottlenecks and thermal throttling with our MacBook Pros and wanted to test iMacs, Mac Pros, M1 Mac Minis, and EC2 cloud machines.

These results surprised us in many ways. Even though the Mac Pro comes with more cores and more RAM, the iMac with an Intel processor performs better in all of our scenarios. We tracked this down to the single core speed in a deeper investigation. The Mac Mini outperformed all other machines by a huge margin in the smaller test scenarios, but lacked the necessary RAM and number of cores for larger scenarios; therefore performing worse in them. EC2 instances are a viable alternative, but are slower than the iMac unless you pay for the expensive “large” instances.
Conclusion
There are a few lessons we learnt along our journey to capture build times.
Measure! Only because something looks better on paper it doesn’t need to perform as expected in real word scenarios. The best example is the Mac Pro.
Capturing build times is hard. Different use cases require different strategies. Build scans are awesome, but the data lags behind.
Be careful how you design benchmarks. Try to avoid external factors that could skew the numbers in a certain direction, such as variable network speeds or cache download times.
Measure frequently and continuously. Sometimes the smallest changes surprise you in such a large codebase where the same codepath is executed thousands of times.
As new Macs become available we’ll run our benchmark suite and make more informed decisions about the optimal developer machine. We were very excited about the performance of the M1 processor of the Mac Mini. However, our repositories come with a specific set of constraints and it isn’t a good choice for us. Newer generations of the CPU will hopefully handle the scale of our project better.
Capturing durations for the entire build and the largest targets opens up new perspectives. Measuring a few or single module build times isn’t enough. We treat our scenarios like macro-benchmarks.


