
Using Word2Vec to Power a Recommendation Engine
By Nicole Mitchell & Joy Wang
About Us
Nicole is a rising junior at Rice University and Joy is a rising senior at University of Pennsylvania, and we are both software engineering interns at Square this summer. Square hosts an Intern Hack Week every summer, allowing interns the opportunity to implement our ideas for new features or tools. Below is a description of our Intern Hack Week project.
Context
At Square, we’re always looking for ways to leverage our large data set to automate customer-facing experiences. As Intern Hack Week approached, we wanted to pick a project that could help inspire everyone to think through more areas where we could automate the work that Square sellers usually have to do when setting up their accounts.
The purpose of this hack week project was idea generation, rather than implementation as a product feature.
We decided to address the perennial issue for sellers of deciding what products to offer and figuring out good prices to drive sales. Market research can be extremely time-consuming, costly, and resource-intensive. Business owners may spend days trying to understand their neighborhood trends and business environment or how they can improve their offerings and prices to maximize their revenue.
After discussing this problem with product managers, analysts and the sales team, we decided to build a tool to give sellers actionable insights into industry and neighborhood-specific trends. This inspired us to develop a tool that would automatically recommend item pricing and additional menu items to sellers based on information from local businesses in their neighborhoods.
We had one week for this project, so we decided to scope it to the food and beverage industry. Nearly 20% of Square’s GPV (gross payments volume) comes from the food and drink industry alone. This massive amount of transaction data provides a bird’s-eye view into neighborhood and industry markets.
Demo: Market Insights Tool
For demo purposes, we built a Python Flask app with D3 visualization that included features for both existing Square sellers and new sellers.
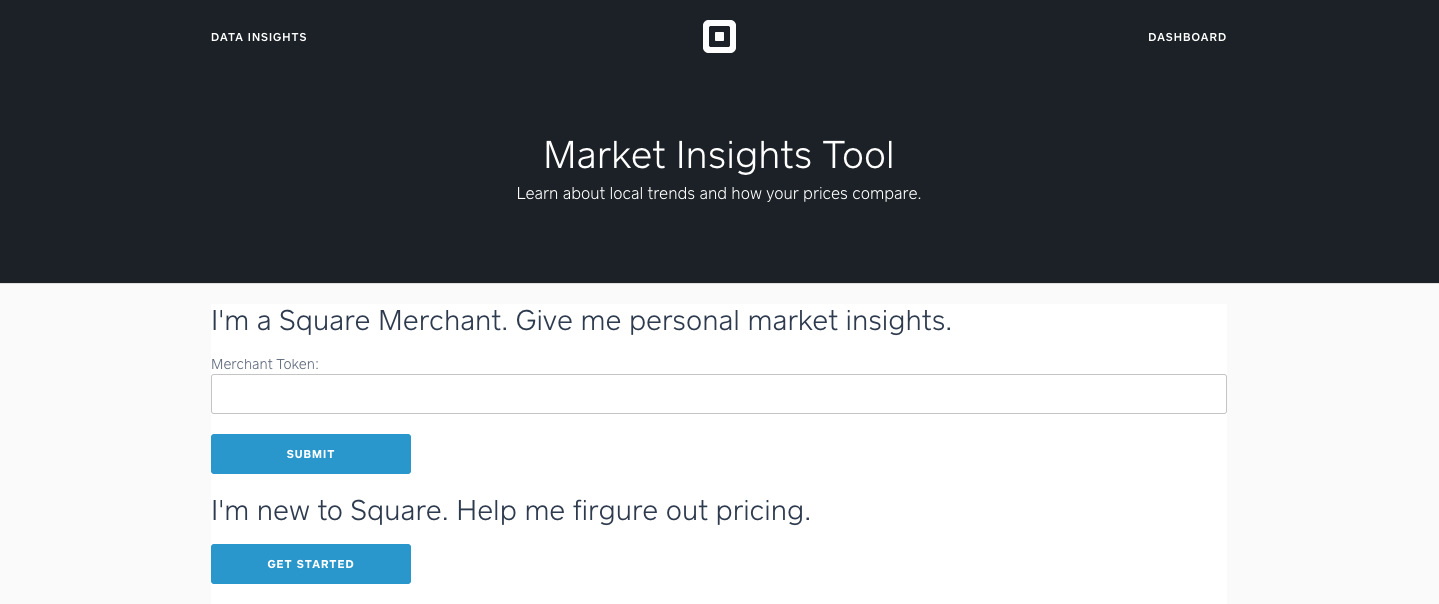 Home Page
Personalized Market Report for Existing Square Sellers
We created a tool where current sellers can enter their user ID and view a customized report. In the first section, sellers can select a product from their own product offerings and see a pricing distribution of all similar items sold by other sellers in their neighborhood. We also included a second section that lists three items the seller is not currently offering but should consider selling, based on what nearby similar Square sellers have on their menus. (See the next part of the article for how we came up with the suggestions!)
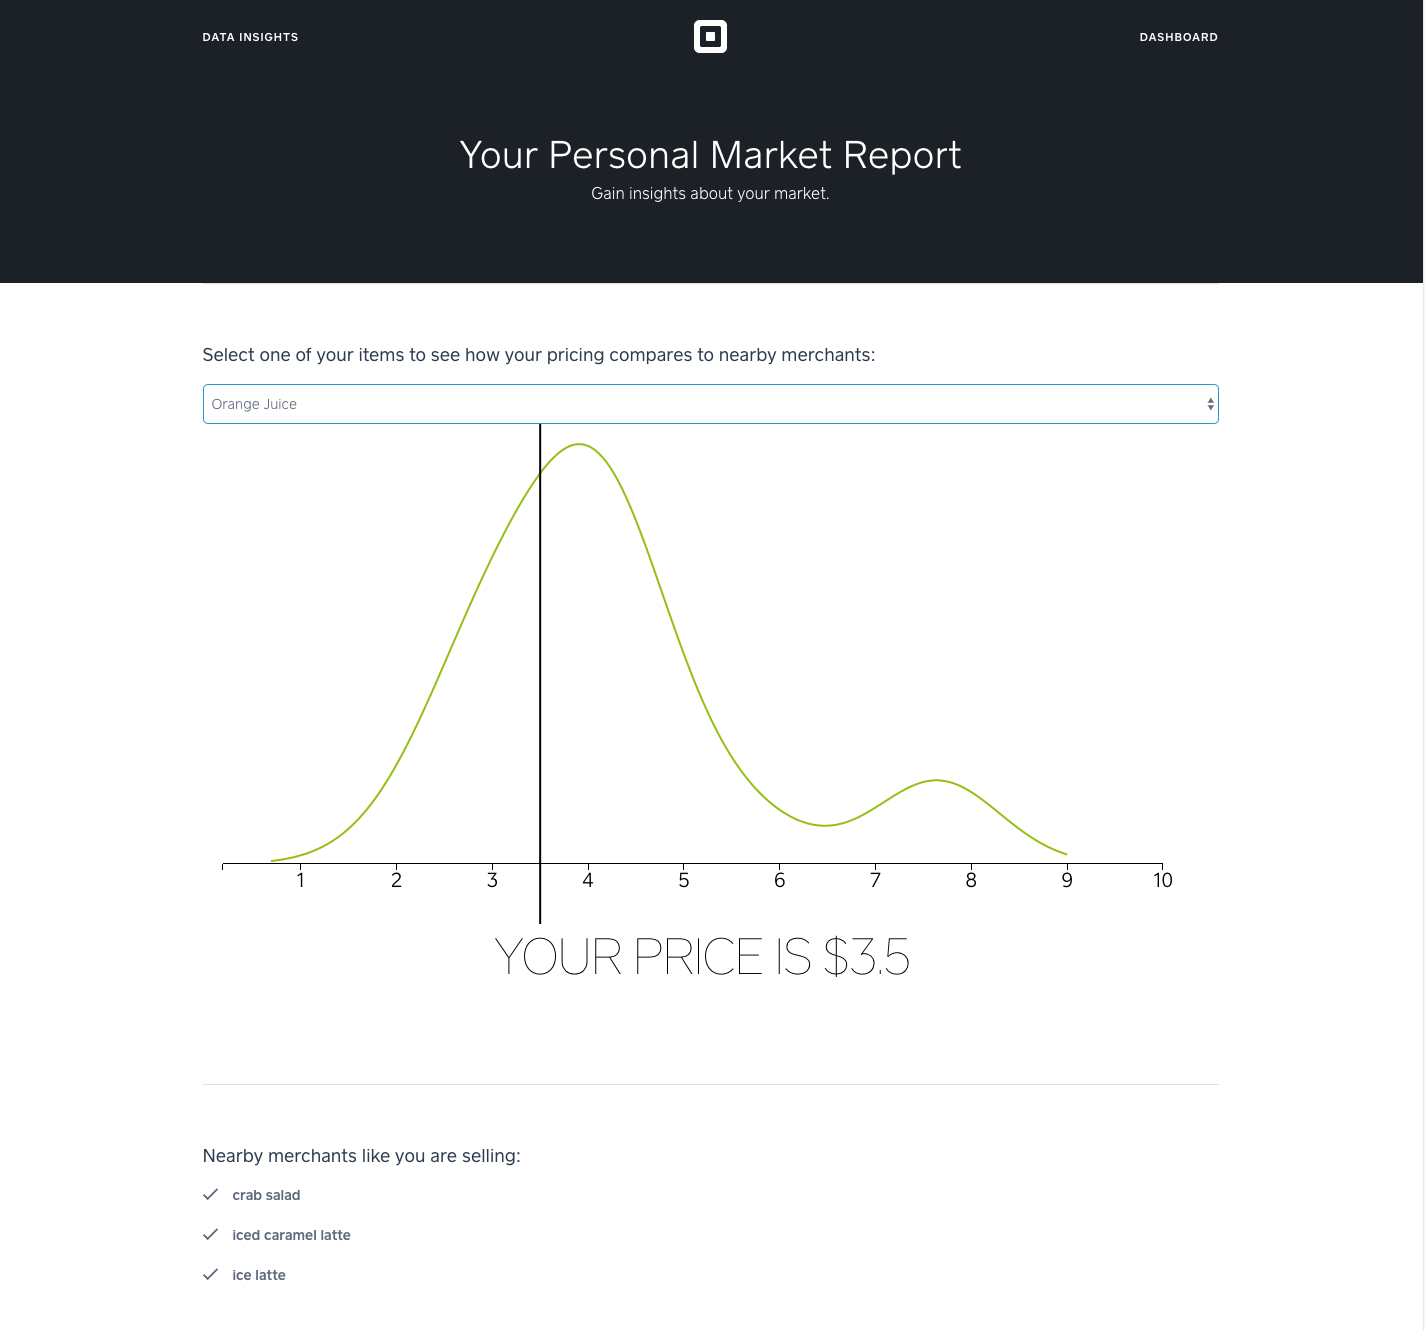 Interface for Existing Sellers
Price Suggestions to Help New Sellers Onboard
For new Square sellers, we used local item pricing data to build a tool that helps them price their menu items. Given the new seller’s zip code, he or she can enter an item to the search bar and get a distribution of prices for that item in their neighborhood, as well as an averaged suggested price-point based on local sellers’ transactions.
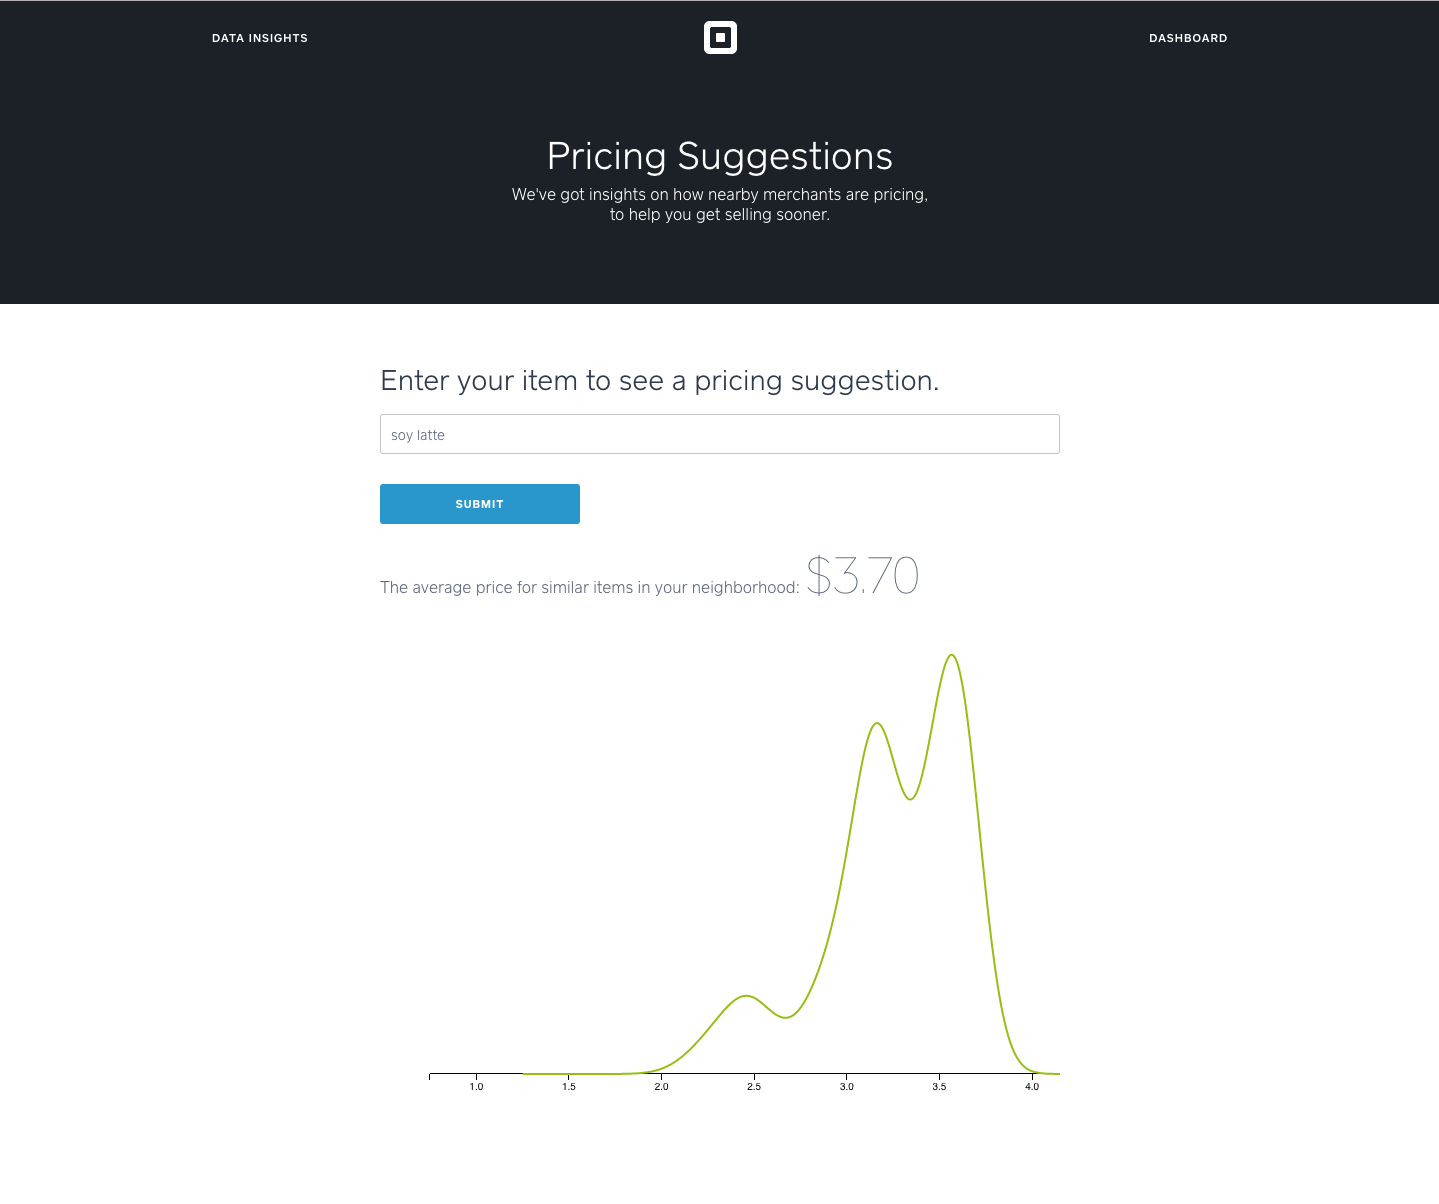 Pricing Tool for New Sellers
The Data Science Behind It
Text data is notoriously difficult to work with! The challenge with free form text data is that sellers enter their own item names for the products they sell, leaving a lot of room for variations in naming conventions. Without rules governing the text entry, analyzing item-level data is quite tricky. For example, a coffee shop owner can create a “latte” or a “Cafe Latte” or a “Frapp LATTE” or a “pumpkin spice latte” and the list goes on. Without a canonical list of item names, the data is extremely noisy and hard to group.
To deal with this lack of structure in item names, we filtered the items in our transaction data using a food database to get only food and drink items.
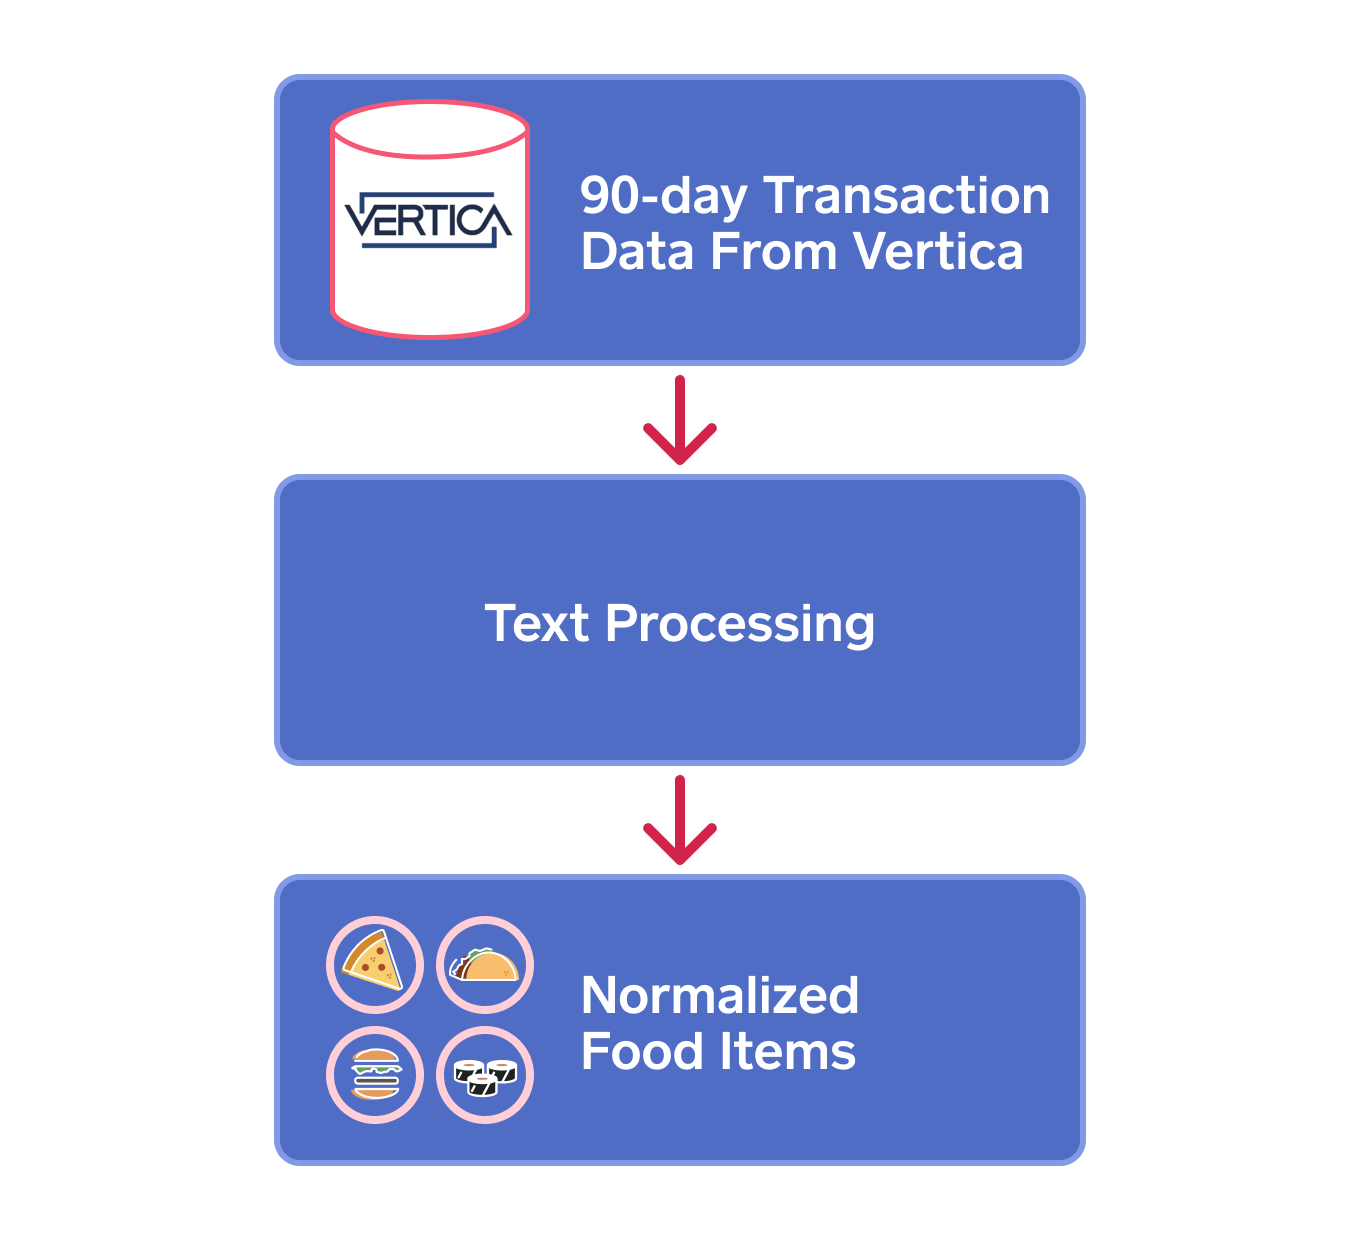 Data Cleaning Process
Our next step was to group these food and drink items, so that we could compare pricing of similar items sold at nearby businesses and suggest new items for Square sellers to offer. The difficulty we encountered when analyzing this text data was accounting for the underlying subtext. Because it is challenging to compare words like “soda” and “pop” and understand their similarity purely by looking at the text, we used a pre-trained word2vec model to perform a lexical analysis. This gensim word2vec model, trained on Google News, represents words as vectors.
With vectorized words generated from running the model on our food and drink data, we were able to do text classification since we could perform numerical comparisons of items. The more closely words are related, the shorter the distance between their corresponding vectors. Because an item name can be composed of multiple words, we summed the vectors of each word and normalized it to get a vector for that item. Therefore, the result of running this model on our food items data set was the grouping of similar items in vector space.
 **Vectorized Mapping of Items**
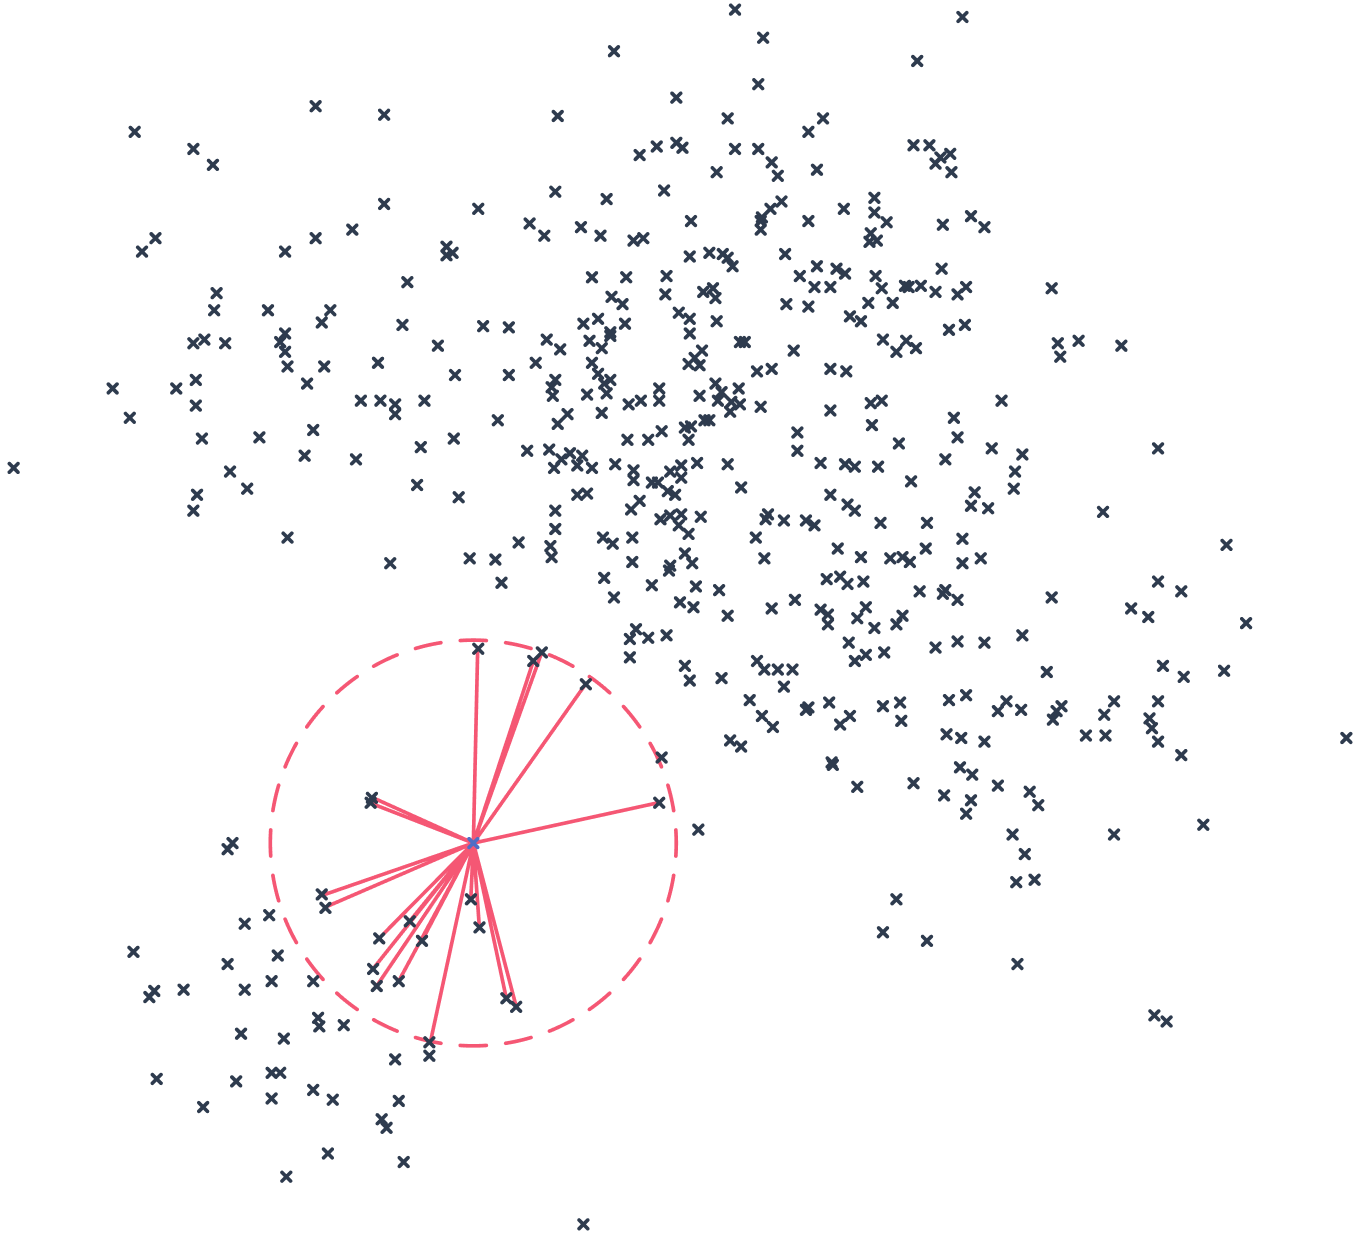
In order to determine these groupings, we calculated the cosine distance between each pair of vectorized items. Taking this *n *x n matrix, we chose a threshold to classify nearest neighbors and then tuned it until it gave us reasonable results. To describe this more visually, in effect we drew a sphere around each item in a vector space and considered all items whose vector was within that sphere to be very similar. Below is an example of our model output. As you can see, the similar items aren’t perfect, but are fairly reasonable. If we analyze words related to burger, we capture chicken sandwich and falafel sandwich, which are obviously not the same, but still related.
Model Output Example
Latte
Burnt Caramel Latte, Cafe Latte, Cafe Latte to go, Cappuccino, Caramel Latte, Chai Tea Latte, Earl Grey Latte, Frapp latte, Horchata Latte, Iced Latte / Matcha Green Tea, Iced Latte/Matcha/Chai, Matcha Latte, Roasted Oolong Latte, Soy Latte, Vanilla Latte, Vanilla Latte, cappuccino
Burger
Hamburger , Lamb Burger Dinner, Lamb Burger Roll Lunch, Caprese Sandwich, Chicken Sandwich, Chicken Shawerma Sandwich, Falafel Sandwich, Falafel Sandwich Dinner, Lunch Chicken Shawerma Sandwich, Lunch Falafel Sandwich, Meatball Sandwich
For each menu item from a given seller, we were able to generate a price distribution using the prices of other items in its nearby space. We estimated an underlying probability density of the distribution through Kernel density estimation, and plotted it to represent the item price distribution among nearby sellers. Looking into the similar items within each item “sphere” for a given seller, we were able to generate item suggestions by returning the top three most frequently occurring similar items that were not on the seller’s menu.
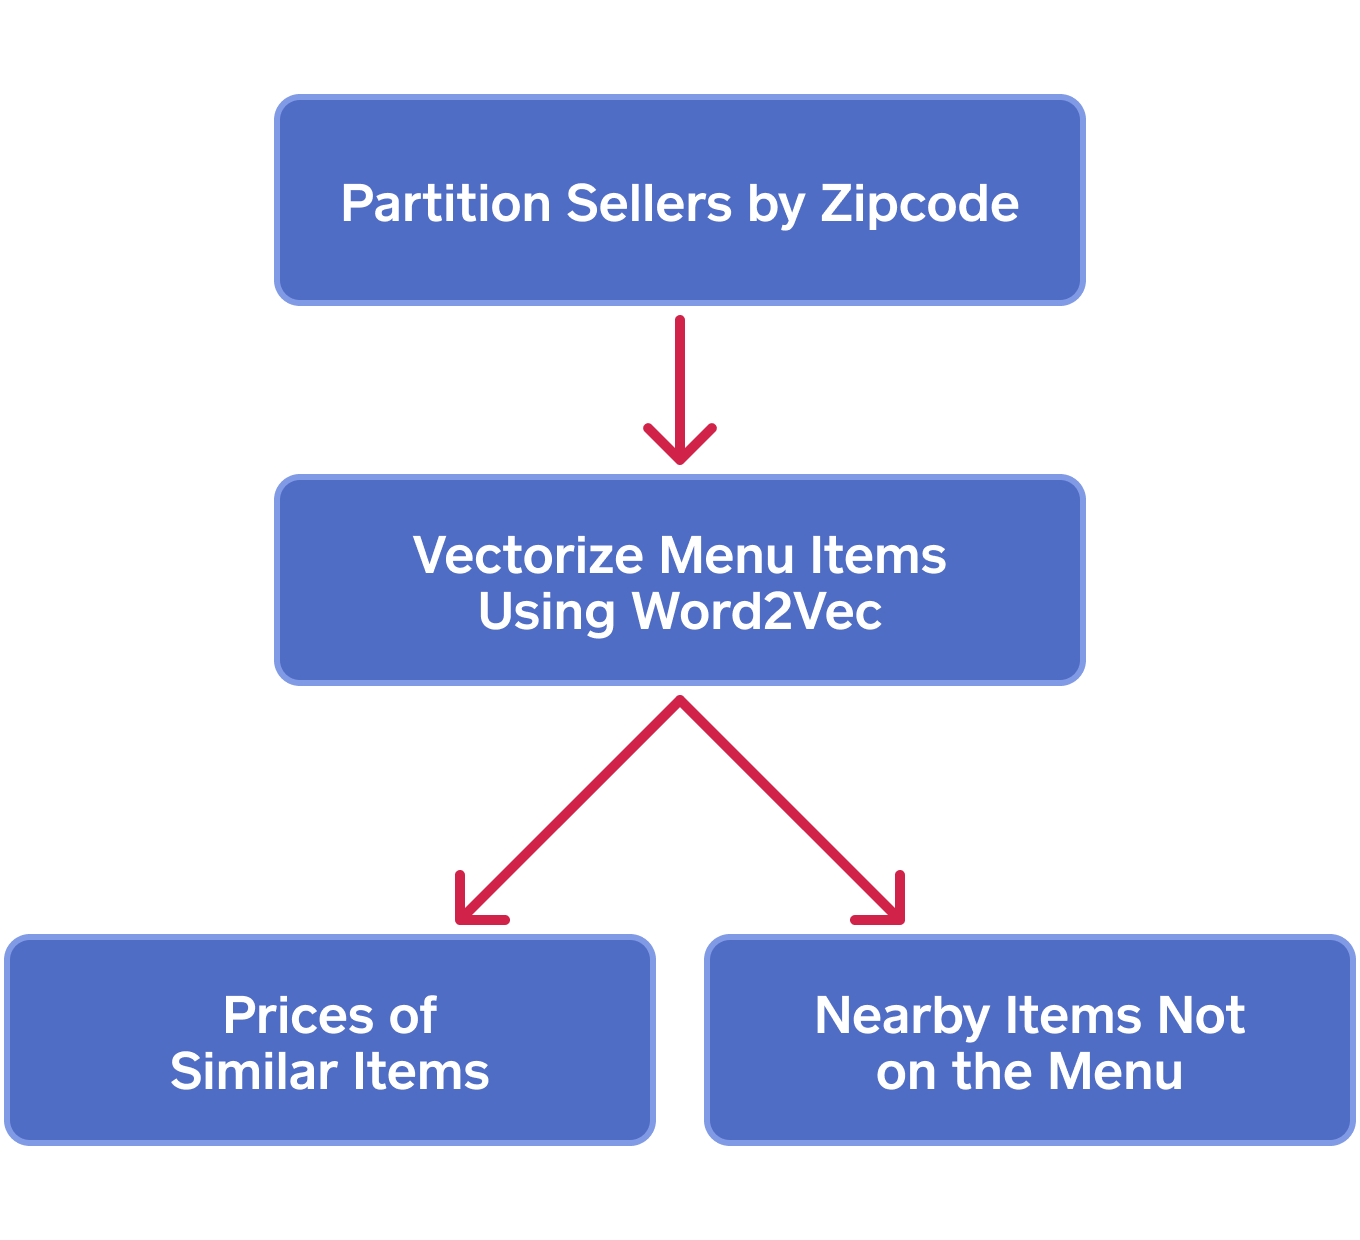 Our Process for Generating Results
Next Steps
This project has helped our product teams think through ways we could automate onboarding for food and drink sellers. Pre-populating prices as new sellers set up their menu items in our point of sale system would streamline much of the work for our sellers and make pricing a much easier decision. In addition, this work could be applied to the seller dashboard reporting page, adding to existing analytical insights powered by Square’s data.
Authored By
