
Supercharging Continuous Integration with Gradle
Unveiling the journey of shard avoidance and Bazel-like queryability
In a previous blog post by my colleague Tony Robalik, titled Herding Elephants we explored the challenges of managing an expansive Gradle project. At that time, we discussed the complexities faced by Android developers at Square as they navigated a project with over 3,500 modules. Since then, our project has grown even further, now comprising more than 5,000 modules. In this blog post, we will delve into the ongoing impact this growth has on our development workflow. For context, our average runtime of builds in CI over the last 6 months has been around 65 minutes per run.
Given these numbers, it’s clear that the process of merging code into the repository can be quite time-consuming.
At Square, we recognize the importance of optimizing build and test performance by efficiently distributing the workload across multiple nodes and making the most of available computing resources. To achieve this, we rely on Kochiku, an open-source (although our internal version has deviated from the original) Continuous Integration (CI) tool developed by Square Engineers.
Kochiku serves as a valuable asset in our quest for efficient parallel builds. It offers a range of features designed to optimize the build and test process. At the time of writing we use this tool for automated sharding, intelligent scheduling, and distributed caching.
However, we acknowledge that there are still challenges to overcome as our project continues to grow. Our CI build for Square Android is split into 1200 shards, and runs over 200 times per day. These numbers continue to grow as we expand and modularize our shards to be of optimal size for our CI workers to run in a reasonable amount of time.
Shard Avoidance
Shard avoidance is a crucial technique we employ to selectively determine which shards should run for each individual build. When any modification to the build graph has transitive implications, it becomes necessary to re-run all affected shards to ensure correctness. However, for shards unaffected by code changes, it is logical to minimize build times and the number of shards to test.
In our initial design, determining which shards to avoid relied on the utilization of regular expression to extract relevant information from the build. Simultaneously, internal projects were initiated to transform the build graph into a data structure suitable for static analysis. This shift toward static analysis emerged from our realization that relying solely on Gradle, our build tool, incurred a significant cost of 3-5 minutes per shard avoidance analysis run.
The impact of implementing shard avoidance allowed us to skip an average of 600 shards per build. Our shards range from build times of 3 minutes to 22 minutes depending on the nature of the work/worker which gives us a total time saving of anywhere between 1800 to 13,200 minutes.
Even with shard avoidance in place we felt there were large gains still to be had. Our belief that a shard should only be run if its associated build files or other global files had changed was backed by data which showed that only 8% of pull requests modified these files. Recognizing this inefficiency we then began the process of using the Tooling API from Gradle in addition to a tool we wrote called Avoidance Cache to minimize the redundancy of analyzing shards.
Gradle Tooling API
Initially, shard avoidance was performed by using a set of internal tools. These tools utilized Gradle to extract metadata of modules into yaml files, which were later read in and analyzed in order to perform the shard avoidance. We simplified these tools and created a new project named Affected Paths, which communicates with the Gradle daemon directly. This change improved the time spent analyzing all the projects, and reduced the amount of memory used.
The idea for Affected Paths, a soon to be open source version of what our avoidance tool does, arose after researching how Gradle interacted with the IntelliJ IDE. The IntelliJ IDE utilized the Tooling API from Gradle, allowing direct interaction with the Gradle daemon. The Tooling API also enabled the gathering of custom models that could be extracted from each project. Notably, the logic for gathering the custom models would only execute when specifically requested by the Tooling API, minimizing the impact on configuration performance. With this realization, efforts began in earnest to replace the existing internal tools with an open source artifact known as Affected Paths.
Affected Paths revolutionized the analysis tool by allowing direct querying of the Gradle daemon, eliminating the need to write metadata to the filesystem and reload it into memory.
This allowed us to use non-specialized workers to run the avoidance analysis reducing the overall queue times. However, the configuration phase remained the most time-consuming part. Recognizing this, we took the opportunity to explore potential alternative sources for metadata.
AST Parsing
AST parsing proved to be a highly effective solution for invoking build logic rules in our previous experiences. Recognizing its potential, we aimed to leverage static AST parsing of build files to produce a build graph that could be consumed by our Avoidance Tool. Our goal was significantly to reduce the heavy lifting involved in the Gradle configuration phase. And our efforts yielded positive results, albeit with some limitations.
We encountered a limitation in the ability of AST parsing to uncover transitive dependencies. It became evident that our build logic applied dynamic transformations that were not reflected in the static build graph. These dynamic inclusions, operating outside the scope of static analysis, posed challenges in accurately capturing transitive dependencies.
Looking ahead, we envision a future where we can strike a balance between dynamic and static analysis in Build Logic. By imposing certain constraints and controlling the level of dynamism, we aim to optimize the AST parsing approach, enabling a more accurate and comprehensive understanding of the build graph, including transitive dependencies.
Avoidance Cache
In the process of determining shard avoidance, running Gradle becomes a crucial step. Gradle produces a build graph of the project, which is then utilized by our analyzer to determine the appropriate subset of shards. However, a question arises: do we need to run Gradle every time? The answer, it seems, is no. This realization is grounded in the fact that Gradle will not produce a different build graph if no build-related changes are encountered.
Therefore, we can perform the analysis on the same set of shards as if Gradle had cached the result of its prior run. This insight opens up intriguing possibilities. If we can key our build files, or any set of files deemed important to the build graph, and save them as a mapping to the outcome of Gradle’s creation of the build graph, we can avoid repetitive Gradle invocations on iterative builds. Most notably, this cache can be shared across all branches of the Android repository.
The implementation of this cache, while not the focus of this article, involves utilizing an S3 data store that saves key (hashes of build files) against the Gradle Tooling response for that build. This response is a data object containing crucial information about the dependency graph.
The avoidance cache project was initiated based on the initial data indicating that only 8% of builds modify build files. This indicated an expected cache hit rate of 92%. As a result, we observed a substantial drop in the time for avoidance analysis to run, with cache hits resulting in avoidance analysis bypassing Gradle almost immediately!
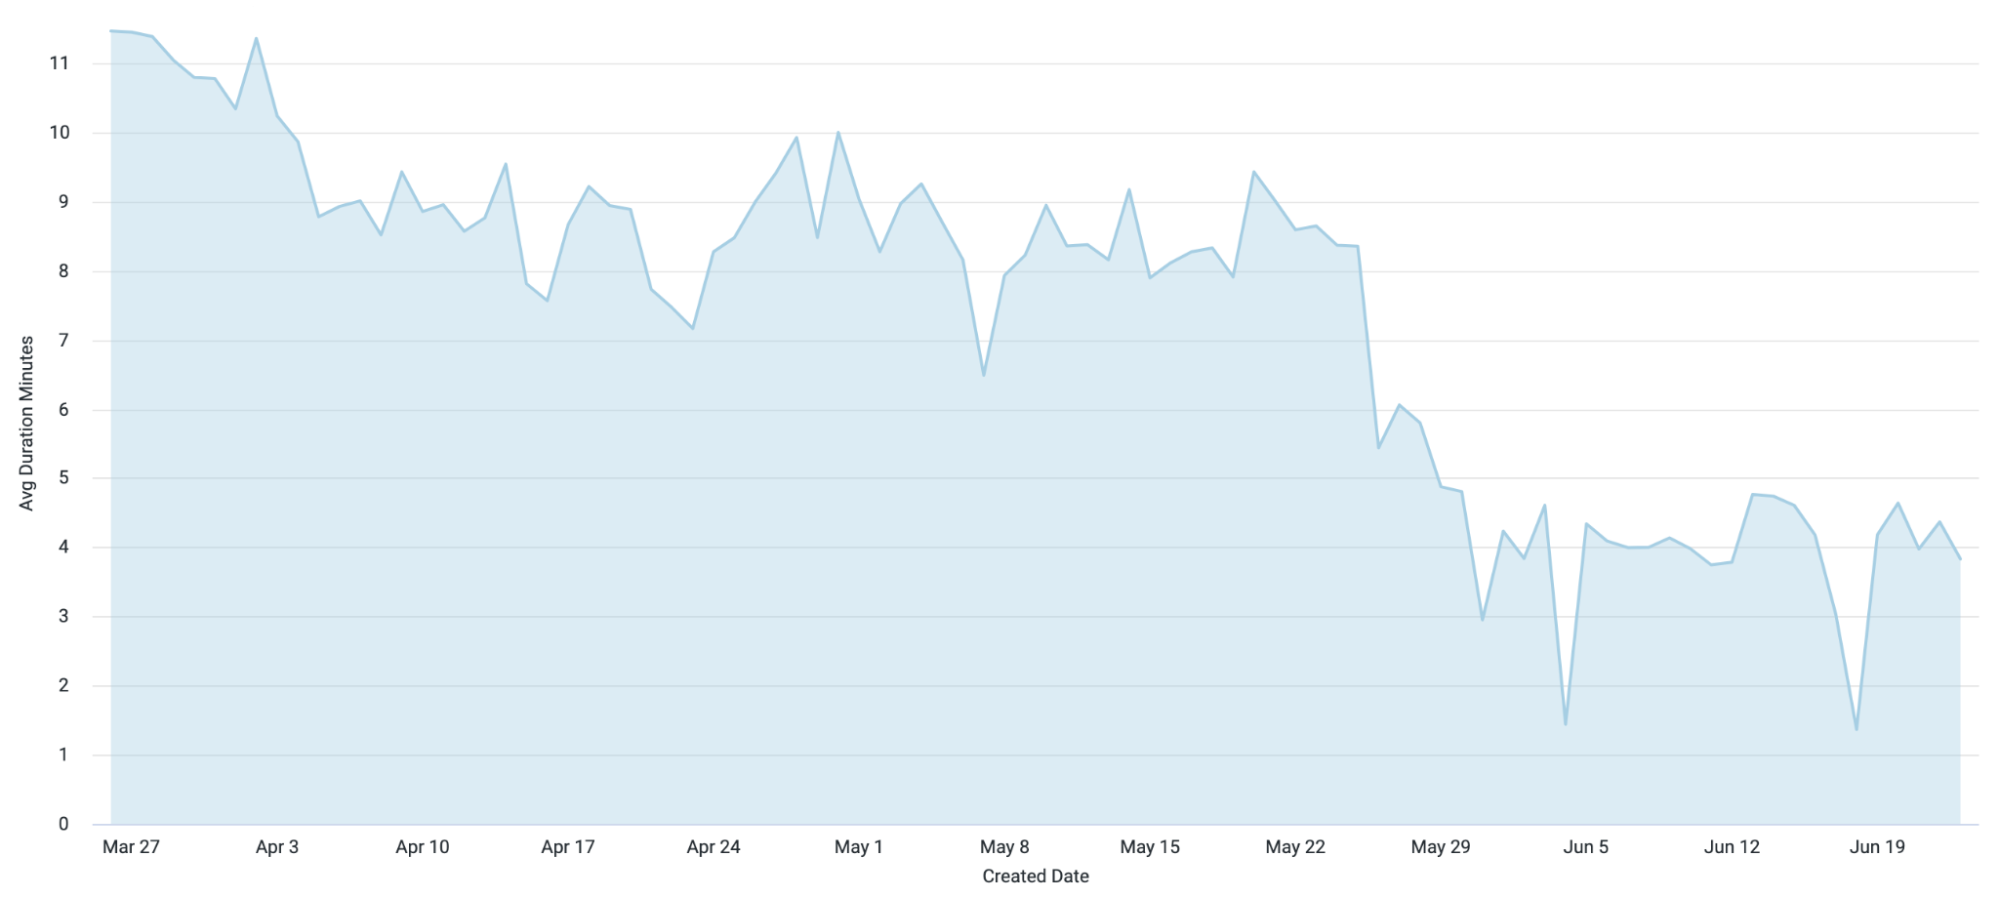
Average Time of Avoidance Analysis over 6 months
Configuration Cache
In a previous blog post, I detailed the significant time savings we achieved by implementing the Configuration Cache on local builds. It was a major breakthrough for us, although initially, we couldn’t extend this benefit to our CI environment due to certain build constraints. However, once we enabled the Configuration Cache by default for all local builds and experienced the remarkable time savings, we began contemplating its potential translation to our CI pipeline.
As the most time-consuming phase in determining the build graph, the configuration phase presented an opportunity for substantial optimization. If we could find a way to share the configuration cache across CI builds, we could eliminate the entire 3-5 minute cost associated with determining the dependency graph.
Although we haven’t fully implemented this solution in our CI environment at the time of writing, we are in the process of investigating how to make it work. The main limitation at this point is Gradle Tooling API’s inability to be compatible with Configuration Cache.
Our algorithm from the avoidance cache, which effectively caches Gradle’s build graph output and retrieves it when available, serves as an inspiration for how to share the configuration cache across builds. By leveraging similar principles we can have a solution similar to avoidance cache with respect to configuration caching.
With the Configuration Cache and avoidance cache joining forces, we envision a future where nearly the entire 10 minute cost associated with avoidance analysis would be reduced to almost zero. This integration holds the promise of a highly efficient CI pipeline, empowering developers with lightning-fast feedback on their changes.
Conclusion
The implementation of Avoidance Analysis has had a significant impact on our build process. By selectively determining which shard to run based on code changes and caching the results of the avoidance outcome for future builds, we have reduced both our build times CI. The avoidance analysis build time, which was 11 minutes prior to these changes, has decreased to 2 minutes resulting in a time savings of 80%. However, we are not resting on our laurels! We continue to strive for further performance gains in our CI environment, exploring new strategies, optimizing resource utilization, and leveraging innovative approaches to enhance build and test processes.
Authored By


