PonyDebugger: Remote Debugging Tools for Native iOS Apps
Remote network and data debugging with Chrome Developer Tools.
Written by Wen-Hao Lue and Mike Lewis.
Web developers have amazing debugging tools right now with Chrome Developer Tools, WebKit Inspector, and FireBug. The iOS team at Square thought, “Why can’t iOS developers use this toolset for native applications?”
As a summer intern at Square, I’ve spent the past four months working with the iOS team on features for Square Register. Mike Lewis, a member of the iOS team at Square, wanted to fix Network Debugging for native iOS applications and started working on a Network Traffic debugger on top of our in-house networking library. During the last couple of weeks, I’ve been working on adding major features and bringing this great tool Open Source for the iOS developer community.
Introducing PonyDebugger for iOS

PonyDebugger is a remote debugging toolset that operates as a client library and gateway server combination using Chrome Developer Tools on a web browser to debug an application’s network traffic and data store. We began by implementing an iOS client library to debug our application’s network traffic sent via NSURLConnection and its Core Data stack. To get started, check out the GitHub repository.
Network Debugging
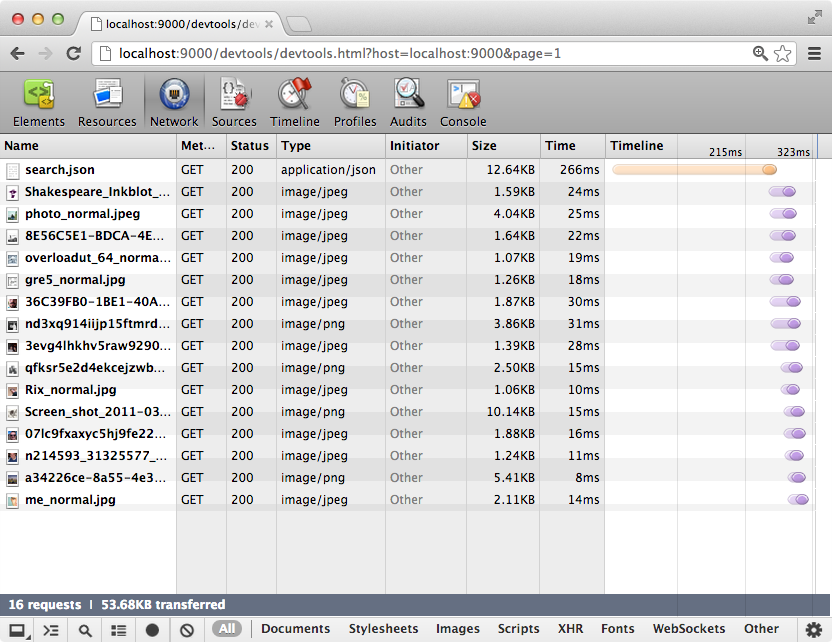
PonyDebugger acts as a powerful network debugger, allowing users the ability to see an application’s network requests in real time. This means that it reports not only all request and response headers, but how long each request takes, associated cookies and the data itself if it is human-readable.

Gone are the days of meticulously NSLog-ging and breakpointing code to verify if requests were sent and responses were handled correctly.
PonyDebugger forwards network traffic without sniffing it. This means that traffic sent over a secure protocol (https) is reported.
We discovered that the network debugging feature works out of the box for AFNetworking, Mixpanel and Flurry network requests. PonyDebugger swizzles class methods in the runtime that looks like it implements NSURLConnectionDelegateprotocol methods. Thus, libraries and frameworks that leverage NSURLConnectionwill automatically start reporting its network traffic.
Core Data Browser
Another cool feature of PonyDebugger is its ability to remotely debug an iOS application’s Core Data stack. By registering managed object contexts, a user can browse all of their entities, properties and drill-down relationships through Chrome’s IndexedDB browser.

The great advantage is that it doesn’t require access to nor implementation of an SQLite data store. This means that browsing data is easy, whether through the Simulator or on a real device. There’s also no difference between tracking an in-memory object store or an object store that has a SQLite persistent store, as it interacts directly with an NSManagedObjectContext.
How It Works
The WebKit Web Inspector, which Chrome Developer Tools is heavily based on, implements a protocol that defines all of the commands, events and types that each debugger “domain” implements. For example, the network debugging feature is implemented by communicating events and commands with Inspector’s Network Domain protocol.
Chrome Developer Tool’s Remote Debugging API exposes and documents (part of) its API for developers to communicate their own data to its developer tools application. We created an iOS client that implements this protocol and communicates a native iOS application’s network requests and managed objects to the developer tools through a WebSocket connection.
Try It
The iOS directory in the GitHub repository comes with a simple test application that demonstrates the network debugger and Core Data browser by showing Tweets in a simple table view. It uses AFNetworking as a networking library to demonstrate PonyDebugger’s capability of proxying network data. It also implements a simple Core Data store to show how it works.
In A Name
The origin of the name “PonyDebugger” comes from Square’s in-house Objective-C networking library, PonyExpress. The original purpose of PonyDebugger was to be able to remotely debug Square’s network traffic. Since then, PonyDebugger has grown to be able to debug other networking libraries and to act as a Core Data browser. Wen-Hao Lue (@wlue) | Twitter *The latest Tweets from Wen-Hao Lue (@wlue). Code, jazz, and startups. Cofounder @sesamehq. @uwaterloo soft eng '14…*twitter.com Mike Lewis (@MikeLewis) | Twitter *The latest Tweets from Mike Lewis (@MikeLewis). maker of stuff. kitten enthusiast. iOS hacker/troublemaker at @square…*twitter.com

