
Mobile Web Performance @ Caviar
Across any e-commerce website, page load times are directly correlated with conversion rate. Faced with a page that takes longer than 3…
Across any e-commerce website, page load times are directly correlated with conversion rate. Faced with a page that takes longer than 3 seconds to load, 53% of users drop off, perhaps never to return. A 1 second delay in load time results in a 7% loss in conversions, 11% fewer page views, and 16% decrease in customer satisfaction. In terms of SEO, slow page speeds also impact indexing algorithms, which hurt crawl efficiency and leads to fewer pages being indexed.
For consumers on mobile, slow speeds are even more painful. As more and more consumers move towards a mobile first experience, we need to optimize for speeds that don’t necessitate blazingly fast internet or even 4G speeds. Typically, improvements in this area means managing your requests and what you load better and more efficiently.
This mobile first perspective is top of mind for Caviar as we expand to new markets this year. During our adoption of this methodology, we started noticing that trying out new features on mobile web seemed to take unusually long. We realized that our mobile web experience was far from ideal as the Caviar website was originally built for desktop. The shift in perspective from desktop to mobile was not a clean switch from a developer standpoint as we naturally have more resources for web and are less likely to test for mobile.
We mapped out the core webpages on our user’s critical path and decided to focus on the starting point: our home page. This is the page most visitors of trycaviar.com start off on and remains one of our most trafficked pages. We used Google Lighthouse to audit our home page as a baseline and full disclosure — it was not pretty.
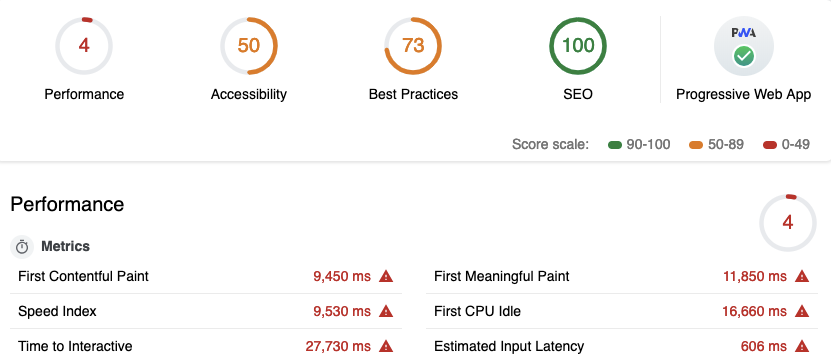 Our initial Lighthouse audit.
Setting Up Metrics
At Caviar, our stack includes React/Rails on our web interface bundled with Webpack, a build tool commonly used in conjunction with React. Webpack is a module bundler that builds a dependency graph starting from specified entry points and spits out a bundle for the browser to load. It’s primarily used for JavaScript but is capable of managing any type of front-end asset including HTML/CSS and even images, and is ultimately responsible for a lot of the JavaScript mangling we ended up doing. A neat tool we use in conjunction with this is Webpack Bundle Analyzer, which allows us to see what and where the dependencies we were pulling in and how much space it takes up relative to others. Later on, this helped us identify duplicate dependencies and dependencies to split into smaller chunks to be dynamically imported when we needed them rather than loading it all at once.
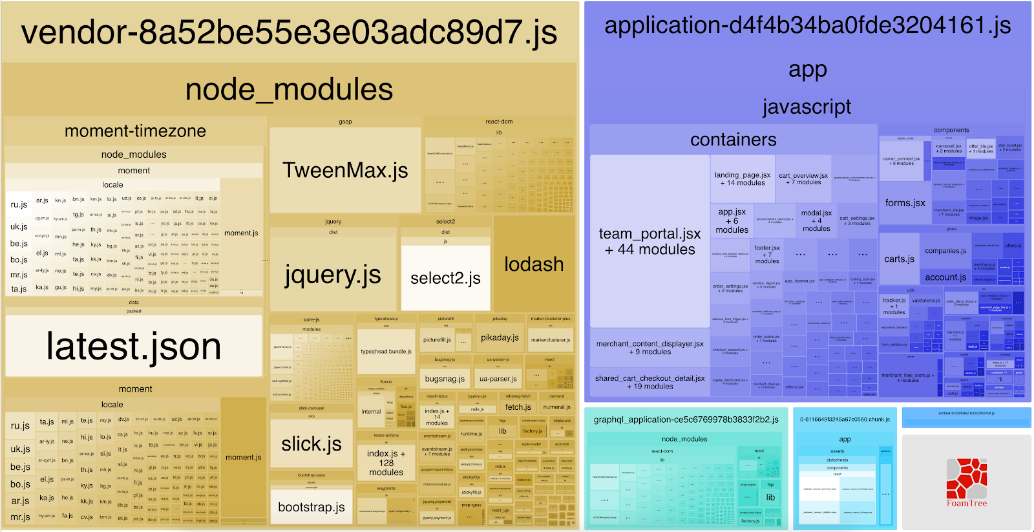 This allowed us to quickly visualize what was going in to our bundles.
We concluded early on that any quick wins would likely not result in noticeable improvement as our senses aren’t capable of detecting microsecond changes. Lucky for us, there are a variety of page performance tracking tools at our disposal. The first step in measuring our success throughout this body of work constituted building out the necessary infrastructure to track our progress and nail down our pain points.
We wanted a simple, systematic way to run the Lighthouse CLI so that it accurately tracked our progress. So we built it into our CI pipeline. We found that Lighthouse scores varied depending on which computer we ran it on so this reduced the amount of variance since it would always be ran on our build machine. We started closely monitoring our JavaScript and installed the bundlesize package to better track the sizes of our application and vendor bundles. Based on this, we added a “budget” test to ensure our bundles were within a specified amount. These changes allowed us to track our metrics based on each commit and determine how new features or code changes affected our performance score with the same level of fidelity. This didn’t mean that it would block any deploys as we could simply increase the budget size by updating the test, but rather raise clarity around the performance impact and have us explicitly confirm that we were (or not) okay with it. For added visibility, we logged the times from browser performance object on each page load, which can be accessed via window.performance, so we could see our progress using data visualization tools.
Now that we had the necessary infrastructure in place to track our progress, we could better visualize the performance implications of our code changes.
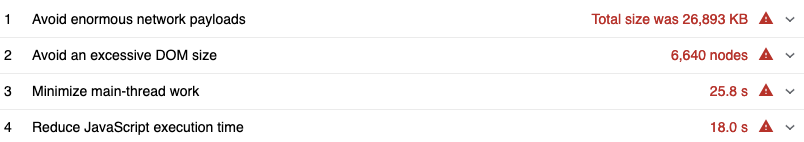 Lighthouse suggestions based on our audit.
DOM Node and Image Optimization
Through Lighthouse recommendations and our analytics tools, we started to identify where and how we could make the most impact. Caviar is an image heavy site, so we deduced that optimizations to image loading could result in massive performance improvements by the power of scale. We found that in some cases, we were rendering image sizes upwards of 3000 x 2000 pixels into a small 260 x 100 pixels space! Here at Caviar, we value high quality images but suffice to say, this was not necessary and negatively impacted our performance with minimal gains in image quality.
We ran our images through an imaging service called Thumbor and replaced all of them with a wrapper that loaded responsive images in a WebP format. This ensured that our users on mobile wouldn’t load larger images than necessary with the added benefit of guaranteeing consistency among our uploaded images, which is incredibly important as we roll out self-onboarding for our restaurant partners this year. This moved our First Contentful Paint metric from 9.45 seconds to 3.5 seconds, an improvement of nearly 6 seconds!
 Can you see the difference? Neither can we.
With the momentum on image-loading in full effect, we continued to scrutinize our requests. We made small changes such as converting our png sprites to svgs so that they load inline instead of performing another network request. We made big UI changes such as rethinking our content on the page. Our home page used to load all restaurants upon landing. After limiting the number of DOM nodes we rendered on the initial page load and requiring the user to click on a CTA to load the rest, we improved our Time to Interactive speed by 4 seconds. Due to the amount of dynamic information on this page, it will almost always have a large number of DOM nodes, but we cut down almost 50% of the nodes on the initial load for one of our most visited pages.
These were quick wins for us, but unfortunately, that was about the extent of what we could accomplish by just focusing on limiting network requests. Now it was time to tackle our JavaScript code execution times.
Downsizing & Chunking Bundles
We started off with enormous bundle sizes by any measure. After going down the list of the biggest packages we had using the visual provided by Webpack Bundle Analyzer as a guiding mechanism, we crossed off ones we absolutely could not remove such as React and unfortunately, jQuery. The remaining biggest offenders were moment and lodash, both huge and accordingly so, two of npm’s most depended upon packages. We found that we were actually loading both moment and moment-timezone. Moment-timezone covered all of our use cases so we were able to remove moment. Webpack by default includes all locale files for moment/moment-timezone. Since we weren’t using most of them, we removed all locale files with the IgnorePlugin and only loaded the ones we needed through a custom configuration file. In a similar string, lodash (CommonJS) was replaced with lodash-es, which is exported as ES modules and is tree-shakable.
We were already bundle splitting our JavaScript code into application and vendor bundles using Webpack through the CommonsChunkPlugin. Briefly, this allows the browser to cache the vendor bundle so that if just the application changes, the client doesn’t need to load the vendor file again.** **Since the page is making a few more requests, there’s slightly more overhead for first time visitors. Client level caching mitigates this cost for recurring visitors, who should see a decrease in page load speed.
For the remainder of the bundles we were serving up, we ran an audit using Chrome DevTool’s code coverage panel to find out just how much JavaScript was used on the page. Not surprisingly, a large percentage of it was being loaded and unused.
 Disclosure: This was after the improvements we made so just imagine it being much worse!
At the time, we were still on Webpack 3 and code splitting was limited by the CommonsChunkPlugin. The plugin only allowed application chunking and sometimes resulted in more code being loaded than necessary due to its parent-child chunking methodology. Webpack 4 has since deprecated this plugin and is now using a more efficientoptimization.SplitChunks plugin, which can handle vendor splitting as well. Code splitting loads code using dynamic imports, so that users only download the code they need for the part of the site that they’re viewing.
// Application
import('./Modal').then(({default: Modal }) => {
  this.openComponent(Modal);
})

// Vendor
import('package').then(({ default: Package }) => {
  Package.doStuff();
})
This syntax automatically tells Webpack to start code splitting at this point and create a separate chunk. Code splitting allowed us to trim down the base bundles we serve up on each page and dynamically load the rest when necessary.
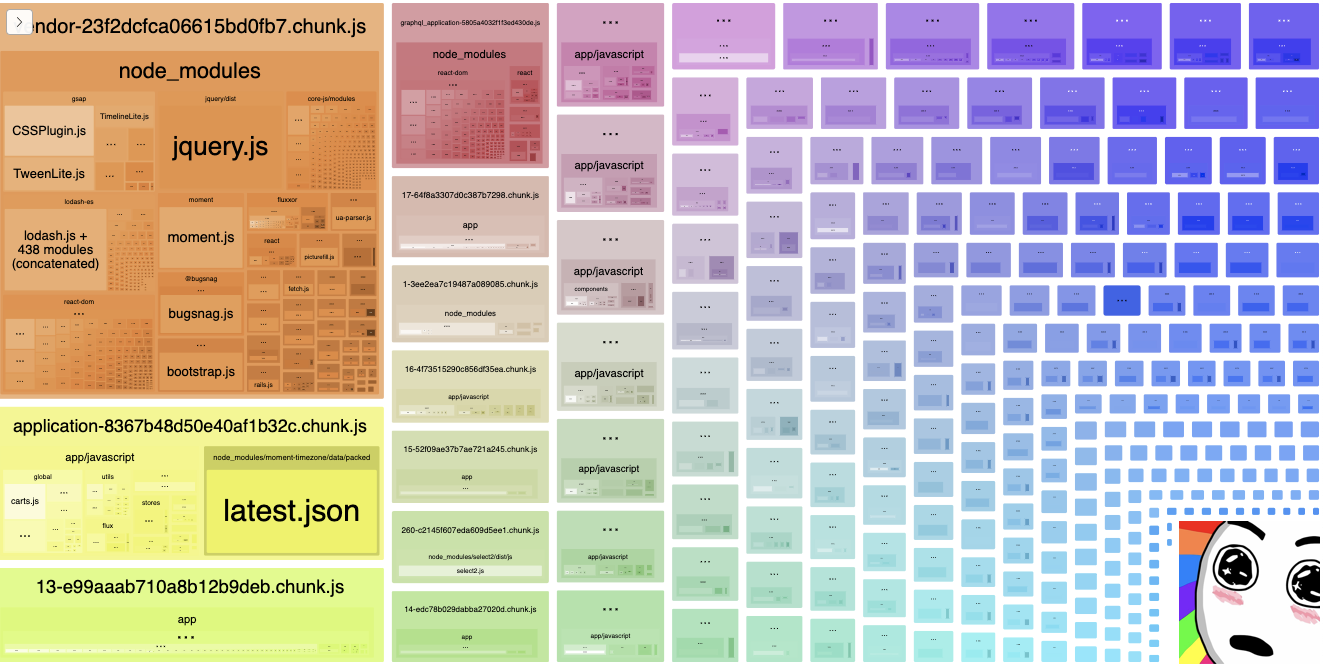 So many colors and chunks!
Instead of directly mounting individual components, we were now dynamically loading the components using react-loadable. However, the improvements in performance were minimal when we were on HTTP/1.1 due to the overhead for the increased number of requests. We started seeing a drastic change after migrating to HTTP/2 thanks to its ability to multiplex parallel requests/responses. This allowed us to quickly reduce the initial JavaScript execution time on the main thread without a large refactor effort and resulted in a material improvement in our Lighthouse scores.
A few days later, our budget test actually ended up catching a code change that pushed our application bundle over the limit! We were able to look through past commits and track down a large increase in our bundle size caused by a change to babel in our Webpack upgrade. By the end of this exercise, we cut down our base bundle sizes significantly:
vendor.js: 436kb → 233kb
application.js: 186kb → 46kb
Final Results
To recap:
-
Resizing/compressing to WebP format and using responsive images reduced our First Contentful Paint by 6 seconds.
-
Limiting our DOM nodes reduced our Time to Interactive by 4 seconds.
-
Optimizing our package usage resulted in a decrease of about 145kb in our vendor bundle.
-
Code splitting and dynamically importing packages and components on HTTP/2 reduced our base bundle sizes by over 50% cumulatively, which further reduced our TTI by 10 seconds and brought it down to about 13 seconds.
In the green!
What’s Next
With the right infrastructure in place and code improvements we’ve made this past quarter, we feel confident in our ability to continue to improve our mobile web performance. We’re taking this to heart as we tackle our next performance frontier: legacy code in the form of jQuery, fluxxor, and CSS. Until next time!
Authored By


