Logging can be tricky
Debugging Go application latency with strace.
Written by Evan Miller.
At Square, we have a mailing list that we use to discuss extremely technical issues, usually requiring in-depth knowledge of underlying system architecture. We dedicated a group to discuss internals with a focus on learning precisely how and why systems operate. When answering questions about systems, the group must also share how they arrived at the answer. We meet weekly to share techniques and raise interesting problems. This post is an example of one such issue raised in our weekly get-together.
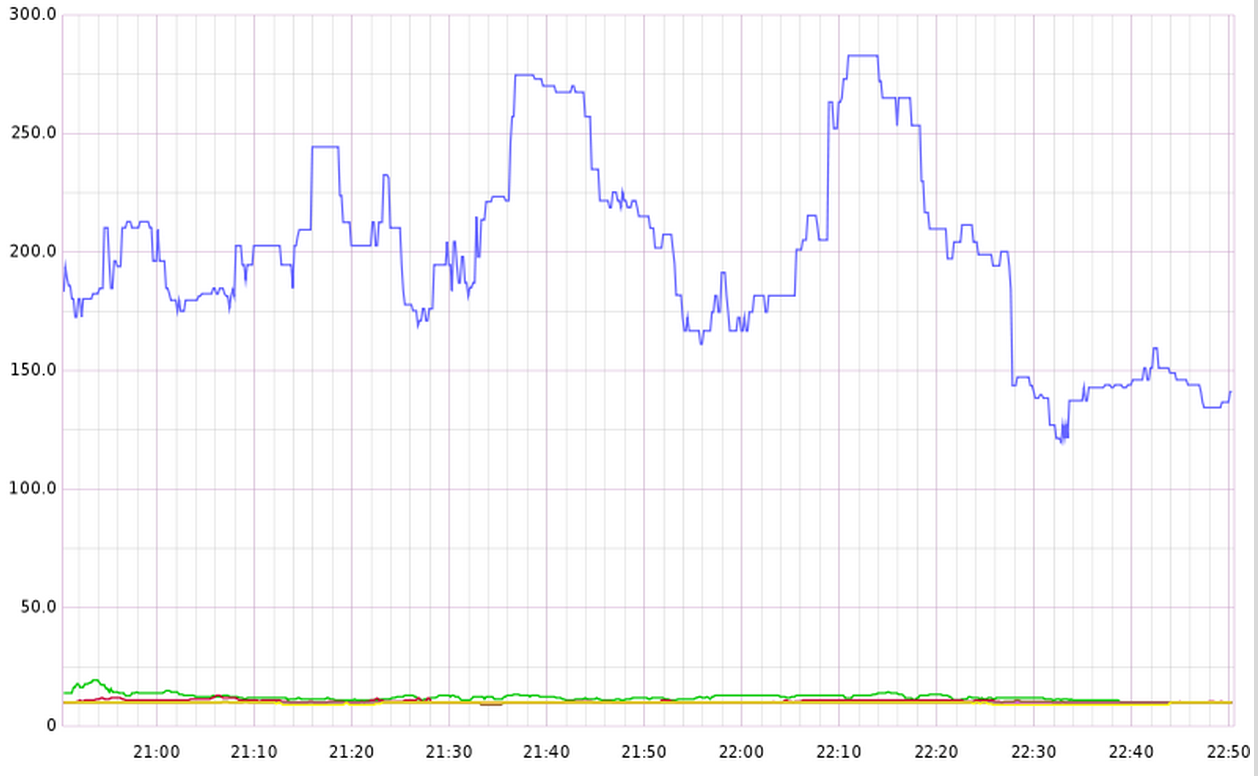
A Go application showed around 200ms latency in the 99th percentile but only on one of three machines in an otherwise uniform cluster. No significant amount of resources appeared to be in use — disk I/O, network I/O, CPU, and memory all looked fairly tame. Furthermore, the bulk of queries being served were all performing as expected. Here’s how we found the problem. First, we started with a graph:

We already looked at the usual suspects: top, vmstat 1, iostat -x 1, lsof, and all the various metrics we graph. Everything looked mostly similar between the systems — same load, same descriptors, same memory use patterns.
So what was up with that problematic blue line only on one host? After verifying it was safe to strace, we poked around a bit in the process, comparing the problematic host with the non-problematic machine from elsewhere in the cluster.
Problem host:
% 22:10 <evan@problem:~ $ > sudo strace -c -f -p 6617
Process 6617 attached with 15 threads - interrupt to quit
^CProcess 6617 detached
% time     seconds  usecs/call     calls    errors syscall
------ ----------- ----------- --------- --------- ----------------
 86.48    1.322219         345      3836       610 futex
  9.95    0.152097          77      1975           epoll_wait
  2.16    0.032983          12      2799           select
  1.24    0.018998        1727        11           fsync
  0.14    0.002151           4       523       243 read
  0.03    0.000391           1       443           write
  0.00    0.000058           1        54        27 accept4
  0.00    0.000018           1        27           setsockopt
  0.00    0.000000           0        32           close
  0.00    0.000000           0       110           sched_yield
  0.00    0.000000           0        27           getsockname
  0.00    0.000000           0         1         1 restart_syscall
  0.00    0.000000           0        59           epoll_ctl
------ ----------- ----------- --------- --------- ----------------
100.00    1.528915                  9897       881 total
Normal host:
% 22:10 <evan@normal:~ $ > sudo strace -c -f -p 9854
Process 9854 attached with 17 threads - interrupt to quit
^CProcess 9854 detached
% time     seconds  usecs/call     calls    errors syscall
------ ----------- ----------- --------- --------- ----------------
 87.30    0.929732         481      1933       224 futex
 10.32    0.109890         110      1001           epoll_wait
  1.32    0.014046           8      1745           select
  0.48    0.005093         849         6           fsync
  0.31    0.003314          10       333       159 read
  0.19    0.001999        1999         1         1 restart_syscall
  0.08    0.000898           3       287           write
  0.00    0.000043           1        30        15 accept4
  0.00    0.000000           0        11           close
  0.00    0.000000           0        51           sched_yield
  0.00    0.000000           0        15           getsockname
  0.00    0.000000           0        15           setsockopt
  0.00    0.000000           0        26           epoll_ctl
------ ----------- ----------- --------- --------- ----------------
100.00    1.065015                  5454       399 total
Strace -c showed us a summary table of time spent in each system call. Notable: We were spending more than twice as long in fsync() on our problem host. Why was that? Let’s look at fsync in isolation. We’ll trace only the fsync syscall and capture the time spent in each call:
% 22:14 <evan@problem:~ $ > sudo strace -e fsync -T -f -p 6617
Process 6617 attached with 15 threads - interrupt to quit
[pid  6723] fsync(3)                    = 0 <0.142015>
[pid  6728] fsync(3)                    = 0 <0.136858>
[pid  6722] fsync(3)                    = 0 <0.000019>
[pid  6722] fsync(3)                    = 0 <0.142367>
[pid  6723] fsync(3)                    = 0 <0.149308>

% 22:14 <evan@normal:~ $ > sudo strace -e fsync -T -f -p 9854
Process 9854 attached with 17 threads - interrupt to quit
[pid  9896] fsync(3)                    = 0 <0.000045>
[pid  9898] fsync(3)                    = 0 <0.000075>
[pid  9898] fsync(3)                    = 0 <0.000077>
Wow, smoking gun! Time spent in fsync accounts for almost exactly the delay we were seeing. We thought this was likely our problem.
We then had to figure out why fsync was only slow on one of these systems. Here’s the catch: fsync() latency is VERY sensitive to writes elsewhere on the filesystem. It is a synchronization point for activity. Neither system has a particularly huge disk I/O workload, but the problematic system’s disk workload is slightly higher (around 20% util) than the non-problematic system (around 5% util). This is enough churn to cause large and occasional latencies when fsync() must block on actually putting bytes on the drive.
Well, our next question: Why is the application calling fsync()? We saw it was syncing descriptor 3, so we had a look:
% 22:13 <evan@normal:~ $ > sudo lsof -p 9854
COMMAND    PID      USER   FD   TYPE   DEVICE SIZE/OFF      NODE NAME

user 9854 user    3u   REG    253,1 15417476 805505381 /var/log/app/app.log.20140829-000000.9854
It’s a logfile. From the filename we could tell it was the glog framework, which must be calling fsync(). The glog framework buffers logs and serializes access to the buffer. The lock is held while logs are flushed, which includes holding the lock during the time spent in fsync(). We had a simple fix: Patch glog and remove fsync() entirely. This allowed logs to hang around in the page cache — and while this didn’t ensure the write() itself won’t block it, the solution does make it much less likely to occur. Making small blocking writes to the disk in the critical path of serving logic — while assuming they are non-blocking — is a fairly common pattern, (and a fairly common source of occasional, hard-to-locate errors in the nth percentile). It’s always surprising when I/O slows under a surprisingly small amount of otherwise unrelated disk activity. Evan Miller (@3ameam) | Twitter *The latest Tweets from Evan Miller (@3ameam): "Some people can't hear new ideas. If you speak about something new they…*twitter.com

