K-Means for Building Better Product Experiences
Square for Retail was released in 2017 as Square’s first vertical-specific Point of Sale — solutions geared toward a particular subset of…
As the team continued to iterate on and improve Square for Retail, we wanted to understand behaviors that led some sellers to convert from a free trial to a paid subscription. We also wanted to understand how they use some of Square for Retail’s key features.
Segmenting key metrics by individual characteristics (e.g. industry or business size) is straightforward and helpful for specific questions that product teams have. However, it’s easy for this exercise to devolve into a state of “analysis paralysis,” when these metrics get too complicated and narrowly defined (e.g. average daily transaction volume by industry, business size, and city), and ultimately uninterpretable.
To understand our sellers better, we used product usage signals to build a K-means clustering model. This allowed us to identify natural groupings of sellers based on how similar they were to each other. Based on ‘representatives’ of each group, we were able to develop a clear picture of who our archetypal customers were. Our goal was to provide the product team with a better understanding of the product’s core customer base and tailor the roadmap to ultimately provide a better seller experience.
(Note: While our clustering model used Square data, the methods and key results below use mock data to to illustrate our approach.)
Methodology + Feature Engineering
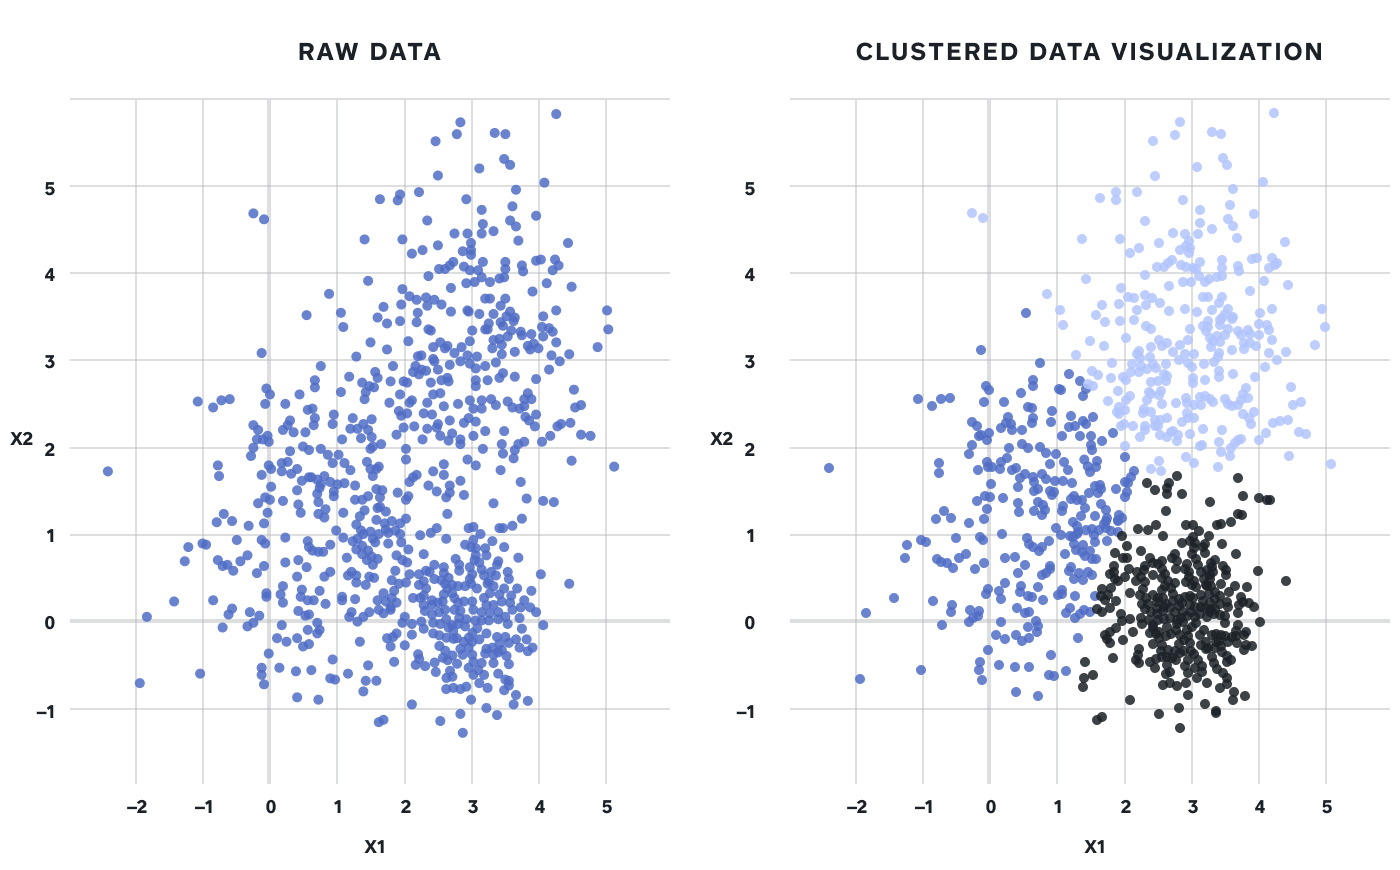
One of the most common ways to apply unsupervised learning to a dataset is clustering, specifically centroid-based clustering. Clustering takes a mass of observations and separates them into distinct groups based on similarities:
Figure 1: Taking a 2-dimensional dataset and separating it into 3 distinct clusters
Data used for the K-means model included seller-level information (number of locations, number of employees, number of devices using Square for Retail, etc.) as well as product usage information (including transactions, inventory adjustments, and creating/editing/deleting items). Data from both* free trial* and paid subscription periods was included, for Square for Retail sellers who had been on the platform for at least 30 days.
Numerical data was aggregated on a seller-level basis in a few ways:
-
Average over the lifetime (in a free trial or paid subscription state) of a seller
-
Sum of the seller’s first 30-day period (for all intents and purposes, their free trial period)
-
The maximum amounts over the lifetime (in a free trial or paid subscription state) of a seller
“How many clusters should I use?” is a common question when employing K-means. There are multiple techniques to determine this — we employed the Elbow method, which looks at the percentage of variance explained as a function of the number of clusters. Essentially, the Elbow method suggests that the number (k) of clusters at which adding another cluster (k+1) only results in a small marginal gain in percentage of variance explained.
Figure 2: Plotting the % of variance (y-axis, intervals of 10%) explained against the number of clusters
While Figure 2 above indicated three clusters would likely be the most ideal, we considered both three and four clusters for our model. After comparing variance for individual features in a three and four cluster model, we ultimately decided four was most representative.
In cleaning our dataset, we removed features which were strongly correlated (correlated features make it harder to interpret the model’s results), as well as features that did not have variance between clusters.
Interpreting the Results
K-means clustering requires numerical data to arrive at a set of clusters. However, after running the model and arriving at our clusters, we also use categorical data (e.g. industry and size of business) to develop a contextual understanding of our clusters. Adding data like this after the model is run also helps us to understand why the data separates in a specific way.
We used Python (pandas, sklearn) to clean the data, build the model, and aggregate our final feature set of clustering data, cluster assignment, and demographic data. For additional visualizations, we imported the final dataset into Tableau.
From here, we explored both numerical and categorical attributes of each cluster in an effort to build ‘representative sellers’ from each.
Results
As mentioned above, the results detailed below consist of mock Square for Retail data and are for example purposes only.

The majority of Square for Retail sellers fell into Cluster 1, with other clusters representing smaller percentages. To understand why and how these clusters are separated, we segmented our dataset by various demographic data mentioned above.
A few examples below demonstrate how the four clusters vary by certain demographics:
Business Size
In this example, one of the biggest takeaways from demographic segmentation is that Cluster 3 contains predominantly larger sellers. Learnings from this cluster could be useful when thinking about developing product features for these more complex sellers.
Free Trial Conversion
Below, we see that Clusters 3 and 4 are most likely to convert to a paid subscription after their free trial. This could mean that from a feature perspective, they are deriving the most value from Square for Retail. Targeting similar sellers in future marketing campaigns could lead to higher conversions.
Sellers in Cluster 3 & 4 showed the highest conversion rate to a Square for Retail paid subscription
Item Interaction
Powerful inventory management features are one way Square for Retail sets itself apart from Square’s core Point of Sale solution. Because these features are built on the foundation of interacting with (e.g. creating, editing, and deleting) items, we wanted to understand how clusters interacted with items differently. An interesting finding was that Cluster 2 sellers were most actively interacting with items on a daily basis:
Cluster 2 sellers were very engaged with creating, editing, and deleting items
Average Transactions Per Day
Anecdotally, in the past, we observed that some sellers used Square for Retail for its unique features, but continued processing payments on Square’s core Point of Sale product. Because of this, another success metric we thought would be useful for this example was whether or not sellers were processing transactions on Square for Retail. We saw that that while Cluster 3 represented a small subset of all Square for Retail sellers, they were incredibly active on a transactions basis:
When it came to average transactions per day, Cluster 3 was way ahead of other clusters
Representative Sellers
With the above example data, we can highlight key qualities observed in each cluster when explaining these mock findings to business stakeholders:
-
Cluster 1 contains a multitude of smaller retailers characterized by their curiosity to try out Square for Retail. Ultimately though, they show the lowest levels of item interaction and free trial conversion.
-
Cluster 2 shows above-average levels of item interaction, which could be common for an electronics store (the most common vertical in this cluster).
-
Cluster 3 represents only 10% of Square for Retail sellers, but Cluster 3 sellers are by far the most active from a transaction perspective. This could be because Cluster 3 contains predominantly larger sellers — sellers who are more likely to have a dedicated account manager to onboard them and facilitate rollout at their multiple locations, driving deeper product adoption.
-
Cluster 4 contains 20% of sellers, with clothing & accessories being the most common vertical. This cluster shows high engagement with key product features, and the second highest conversion rate to a paid subscription.
Conclusions
Using this mock data, the clustering model produced four distinct clusters of Square for Retail sellers. These results, had they been real, could produce a few key learnings to help influence the product team’s roadmap:
-
Cluster 3 has larger sellers who are heavily using Square for Retail at multiple locations. This could help inform that (1) the product should be differentiated enough from Square’s free offering enough to appeal to more complex sellers who wouldn’t have considered Square for their needs in the past, and (2) more account management resources be dedicated to Square for Retail.
-
Cluster 4 contains twice as many sellers as Cluster 3. Given their high engagement with key inventory features, high average transaction size, and high conversion rate from free trial, Cluster 4 could represent a “sweet spot” to keep in mind when choosing what features to build/prioritize in the future.
Employing K-Means clustering for a newer product like Square for Retail helps the team better understand the customers we are building for. A benefit of this type of analysis is that once the model is built, it can be re-used in the future as the team releases new features or gains more customers. It’s worth noting that clustering performance can vary based on the choice of model, ways in which data is aggregated, use case, etc.
We presented the actual results a few weeks before the team took time off for the holidays, and one lead described this analysis as an “early Christmas present.” So there’s that kind of benefit, too!


