
iOS 9 upgrade: Why did my unit tests grind to a halt?
An investigation into why upgrading from iOS 8 to 9 SDK led to slow tests.
Written by Alan Fineberg.
While upgrading Square Register from iOS 8 to iOS 9, we found that our unit test behavior changed in a way that was difficult to diagnose. We investigated the issue and retraced our steps to arrive at the root cause. Ultimately we found that the underlying problem was not just specific to Square, but an issue that could affect any iOS developer.
Tests Are Now Slow, Unreliable
At nearly 7 years old, Square Register for iOS is a hefty app that contains well over a million lines of code. While moving the base SDK from iOS 8 or iOS 9 may seem straightforward, the sheer scale of such a change presented many challenges.
Chief among these challenges involved the app’s test suite. Shortly after implementing the change, we noticed that our unit test suite — with its thousands of tests run for each build — had significantly slowed and would eventually fail. These test failures never occurred when run individually, but often failed as part of a larger suite of tests, and not always in the same way. Since no single test was faulty, a plausible explanation indicated pollution of the shared test environment.
It’s the Main Queue!
The next step was to reduce the size of our haystack. We began commenting out tests to narrow the scope. Commenting out file after file grew tedious — we’ve included a category trick that makes life easier (below). Unfortunately, a better way to run just a subset of tests matching a naming pattern in iOS doesn’t exist:
#import <objc/runtime.h>

@implementation XCTestCase (Debugging)

+ (XCTestSuite *)debug_defaultTestSuite {
    NSString *className = NSStringFromClass(self);

    // Only run tests that start with SQR.
    if ([className rangeOfString:@"SQR"].location != 0) {
        return nil;
    }

    // Calls the original method.
    return [self debug_defaultTestSuite];
}

+ (void)load {
    // Swizzle defaultTestSuite
    static dispatch_once_t onceToken;
    dispatch_once(&onceToken, ^{
        Class class = object_getClass((id)self);

        SEL originalSelector = @selector(defaultTestSuite);
        SEL swizzledSelector = @selector(debug_defaultTestSuite);

        Method originalMethod = class_getClassMethod(class, originalSelector);
        Method swizzledMethod = class_getClassMethod(class, swizzledSelector);


        BOOL didAddMethod =
        class_addMethod(class,
                        originalSelector,
                        method_getImplementation(swizzledMethod),
                        method_getTypeEncoding(swizzledMethod));

        if (didAddMethod) {
            class_replaceMethod(class,
                                swizzledSelector,
                                method_getImplementation(originalMethod),
                                method_getTypeEncoding(originalMethod));
        } else {
            method_exchangeImplementations(originalMethod, swizzledMethod);
        }
    });
}

@end
Above: a useful category to only run a particular set of tests that match some string pattern.
Using this filtering, we narrowed it down to a handful of test classes to consistently reproduce a failure. Then we noticed a curious thing: it didn’t matter exactly which tests were running per se; it was the quantity of tests which determined the outcome.
We saw that the set of tests needed to run for around three minutes; any less and they’d all pass. One test in particular would fail before all the others, and it became the focus of the rest of the investigation:
- (void)test_thatDeadlocks_whenRunAsPartOfALargerSuite {
  SQRTransaction *transation = [self.testFixture createNewTransactionAndSaveContext];
  SQOTOpenTicket *associatedOpenTicket = [transaction.cart.openTicket SQOT_associatedOpenTicket];
  // ...verify setup...

  XCTestExpectation *completionHandlerExpectation = [self expectationWithDescription:@"Completion handler called"];
  [self.openTicketsBroker lockOpenTicketForUserInteraction:associatedOpenTicket withCompletionBlock:^{
    // ...
    [completionHandlerExpectation fulfill];
  }];

  // This fails (times out) even if we allow a full 10 seconds.
  [self waitForExpectationsWithTimeout:10 handler:^(NSError *error) {
    XCTAssertNil(error);
  }];

  // ...
}
Above: the primary test failure that we tried to track down. Note the use of spinning the runloop (waiting for the expectation) and locking.
The failure happened after spinning the runloop, i.e. the expectation was never fulfilled. We were waiting for work to be performed on a queue, but the test would time out instead. So, we decided to look at all the queues…
Ah ha! The main queue was already clogged with an excessive number of operations by the time we reached the problem test in our larger test run:
(lldb) p (int) [[NSOperationQueue mainQueue] operationCount]
(int) $6 = 2781
We had found the culprit: the tests were slow because the mainQueue was overburdened, and our first test failure was due to waiting for an unlock operation that was stuck on this queue.
To demonstrate that the queue was the source of problems, we added a call to [[NSOpertaionQueue mainQueue] cancelAllOperations] in the test’s tearDown method; the tests now passed!
By stepping through line by line and watching for changes in [[NSOpertaionQueue mainQueue] operationCount], we tracked it down to a specific module that was invoked when setting up test fixtures. It would add 4 scheduling operations to the mainQueue for each test fixture that was created (one for every setUp). These operations would accumulate because they were not given an opportunity to drain off of the mainQueue. That explains why a large set of tests exhibited the issue, but a smaller set did not.
It looked like the case was closed. We were ready to make a few adjustments to the module in question and “call it a day”, but this particular “day” would not be “called” so readily and the case remains open!
Actually that’s not it!
We had fixed the scheduling issue with the test fixture, but found that there was still a problem.
We first attempted to verify our fix by swizzling NSOperationQueue such that it refused all other work added on the main operation queue, except for the work done by the failing test.
Bad news: the failure still happened, but now, it took a much larger test suite to reproduce! The failure would occur even when the mainQueue had just one operation to perform, and it was puzzling why this queue–with only a single operation–would not drain. It clearly was not a case of the queue merely being “slammed” as previously thought.
In other words, the same test still waited forever for an operation on the mainQueue, even when the mainQueue looked like this:
(lldb) p (int) [[NSOperationQueue mainQueue] operationCount]
(int) $6 = 1
The unlock operation was still stuck on the queue, even when nothing else was on the queue!
Stepping back
Since our test failure manifested as a deadlock (a lock that’s never released), we dug into the synchronization code (excerpt below) and searched for race conditions next. Because tests ran in parallel, it seemed plausible, but this was grasping at straws. Though we frequently thought we were on to something, we came up empty handed when it came to finding a race condition.
- (void)lockWithCompletionBlock:(dispatch_block_t)completionBlock {
  @synchronized(_lockSempahore) {
    if (!self.locked) {
      self.locked = YES;

      [[NSOperationQueue mainQueue] addOperationWithBlock:completionBlock];
      return;
    }
    [self.blocksWaitingOnLockAcquisition addObject:completionBlock];
  }
}
Even though the main queue and locks are involved, and no matter how badly we wanted to find a race condition, this was not the issue.
Out of ideas, we start ripping apart the problem test to see what surfaced. We commented out or replaced as much as we could to reduce its scope, and even replaced the XCTestExpectation with hand-rolled runloop spinning.
A Happy Accident
I made a mistake with time unit conversion while I was replacing waitForExpectationsWithTimeout, and now the test would spin for 1000x the intended duration. I paused the debugger as it spun, and noticed something curious. More often than not, pausing the debugger would land on processPendingChanges, a method that NSManagedObjectContext uses to save CoreData updates.
Although pausing the debugger while the problem test spun was one of the first things I tried (and gave up on), I didn’t land on anything interesting until this moment (Instruments could have also provided a clue if I had thought to use the Time Profiler). A couple of missed chances, but now we were on to something.
A recurrence of processPendingChanges while waiting seemed interesting, but we needed more information to determine what it meant.
To see how many NSManagedObjectContexts were calling processPendingChanges, we added instance logging to our NSManagedObjectContext class using a static NSHashTable (similar to the below example):
@implementation LiveInstanceTracking

static NSHashTable *instances;

- (instancetype)init {
    self = [super init];
    if (self) {
        if (!instances) {
            instances = [[NSHashTable alloc] initWithOptions:NSHashTableWeakMemory capacity:1000];
        }
        [instances addObject:self];
    }
    return self;
}

- (void)dealloc {
    [instances removeObject:self];
}

@end
We subclassed NSManagedObjectContext and added instance tracking similar to the example above.
Using this instance tracking, we found that hundreds, and potentially thousands of these contexts were persisting between test runs. Even worse, they would perform work on the main runloop, and it seemed plausible that these leaked contexts were starving the NSOperationQueues out of the runloop.
In other words, there was a (mixed metaphor warning) stampeding herd of NSManagedObjectContext processPendingChanges calls during the runloop which starved our NSOperationQueue. Our mainQueue was not able to drain because this avalanche of scheduled calls ate up all of the runloop’s available bandwidth each cycle.
It’s a memory leak!
Ok, so NSManagedObjectContext was being retained (leaked) between test runs. That reduced down to finding where the object’s retain count was increased, where it was decreased, and why the former was greater than the latter.
Luckily, Xcode comes with a tool called Instruments which has a Leaks Diagnostic tool. So we just right-clicked on the test name and selected Profile SQOTAdditionsTest and voila, Instruments made it all clear. WRONG! Sadly, none of that happened, starting with Instruments attaching itself through this menu:

Frustratingly, this Xcode feature merely launches an inert instance of Instruments instead of attaching to a process.
Instead, to profile a test run, we had to:
-
set a breakpoint in the code,
-
run the test,
-
launch Instruments,
-
carefully attach to the correct process by process ID (there may be duplicates in the dropdown list)
-
and hit Record.
The Leaks tool did not consider the NSManagedObjectContext (an SDManagedObjectContext in the screenshots below) to be a leak because it was eventually torn down. But it did report a list of retain/release pairs. So, we looked at a list of over 6000 retains/releases for a single object. At the time, we didn’t see the culprit, so it was back to debugging via lldb.
After a lot of debugging and printing out the [context retainCount] we found that the the context’s save: method adds a retain, and, if we commented this line out, the context was cleaned up as expected(!), and the leak was plugged.
I returned to Instruments to cross-check its report with this new information, and sure enough, there it was:
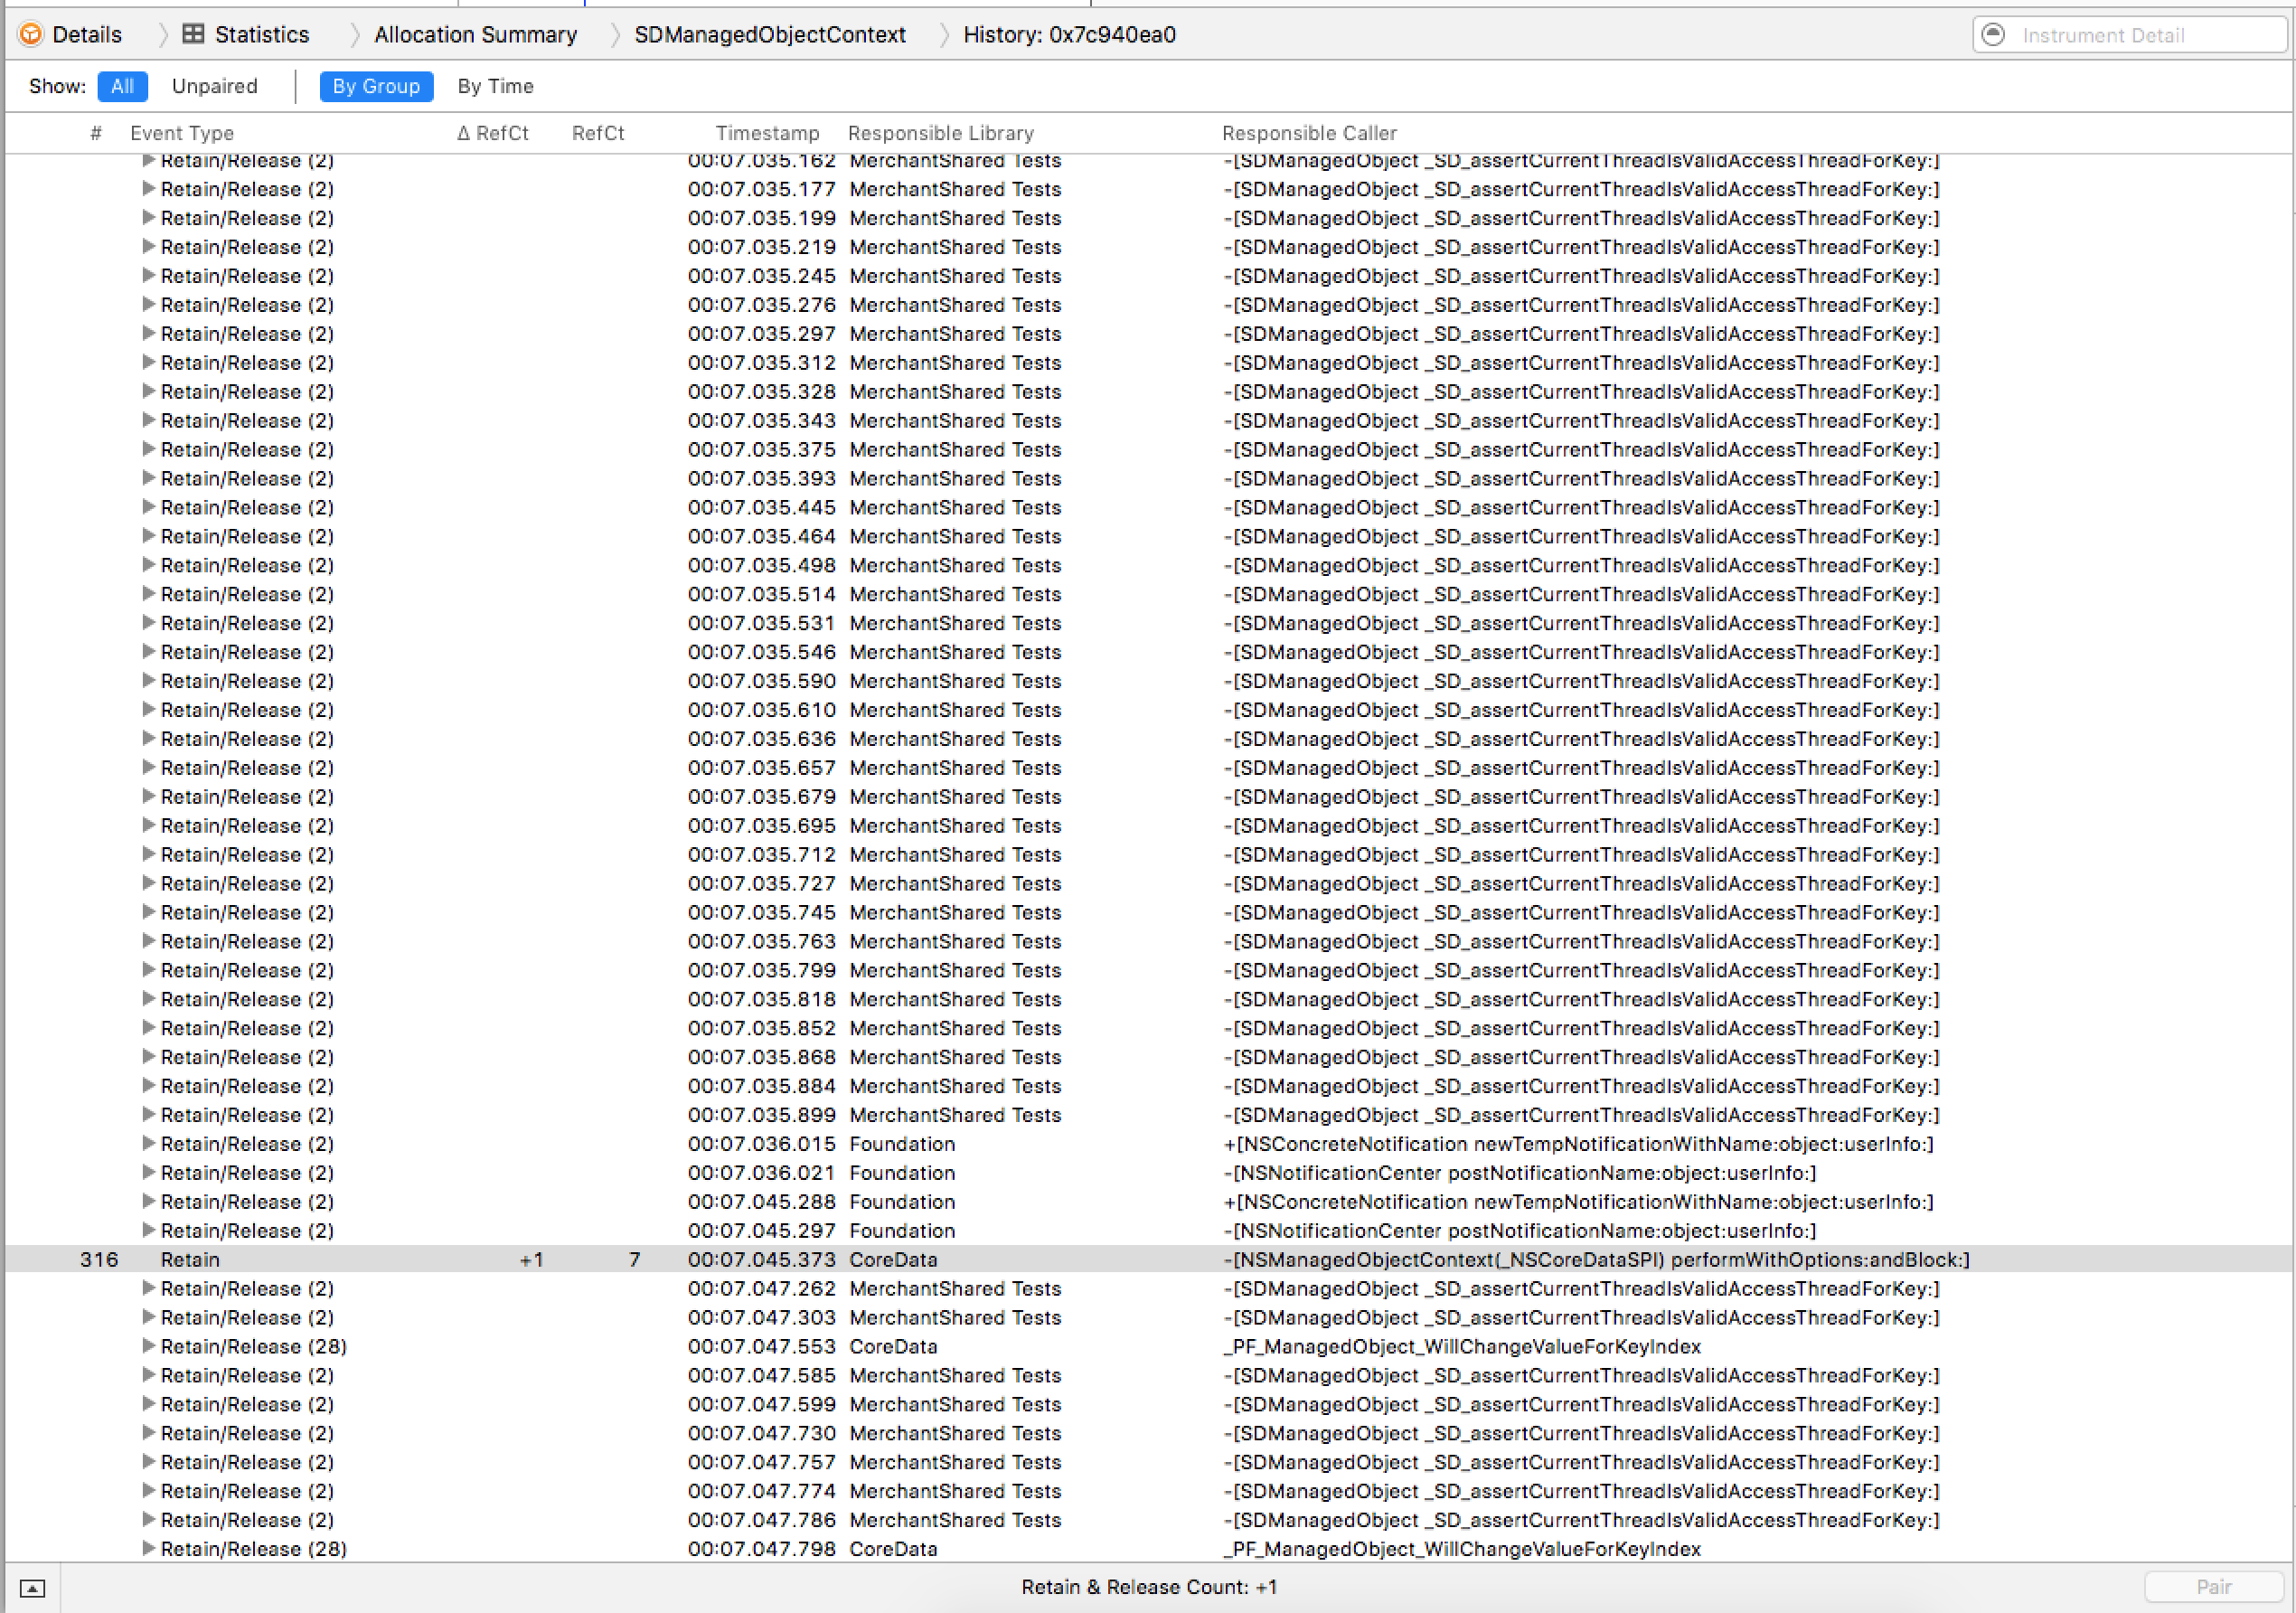
Lo, an unpaired retain.
A detail view of the retain which leads to the leak:

Detail view from Instruments: the stack trace includes save:, CFRetain, and _registerAyncReferenceCallback (sic)
Diagnosis
To debug, I overrode and also set a symbolic breakpoint for NSManagedObjectContext(_NSCoreDataSPI) performWithOptions:andBlock (based on Instruments output above). I’m not fluent in assembly, but I was able to follow along by reading the comments:

On line 91, we increase our retain count. On line 132, we add asynchronous work to a queue.
We deduced that when save: is called, the context is queueing some work and retaining itself in the meantime (stepping through and calling p (int)[$esi retainCount] confirmed this). This work also decrements the retain count, but since it stays on the queue, the self-retained context sticks around forever. We also stepped through while using sqlite3 and .dump to verify that no data was lost if the enqueued work never ran.
Thinking that we finally understand what’s happening, we stepped away to create a small test project to isolate our suspicions and confirm that the issue is present in a simpler example. It’s confirmed! The sample project exhibited the same issue (try it out!).

Using symbolic breakpoints to determine the behavior differences in Xcode 6 v. 7
We compared iOS 8 vs iOS 9 using this test project. It was clear: save: isn’t async in iOS8!**
** Let me qualify this: (as far as I can tell from the assembly) iOS 8 save: was synchronous in its “standard codepath” and did not enqueue work with dispatch_async. As of iOS 9, it now is asynchronous and immediately invokes dispatch_async as part of its “standard codepath.” I encourage checking out the sample project and comparing it in Xcode 6 vs. Xcode 7 (compare the masterbranch with xcode-6).
Treatment
Unfortunately, the only way to get the context’s async work off of the mainQueue is to spin the runloop. If left alone, operations will build up in the background, and when the runloop finally does run, the contexts will starve the operation queues.
So, our fix is to add code that looks like this to tearDown:
[[NSRunLoop currentRunLoop] runMode:NSDefaultRunLoopMode beforeDate:[NSDate dateWithTimeIntervalSinceNow:0.001]];
Some contexts were still leaked after this, but these were legitimate memory leaks from services that weren’t fully torn down.
Ensuring all of our t’s are dotted, I add conditional breakpointing to the context’s dealloc breakpoint, and have it play a sound and halt when there are more than 2 dozen instances hanging around:

Playing a sound and using a condition means we can let the tests run and get alerted when too many instances piled up.
Although it takes a while to work through the entire test suite, thanks to our instance tracking, it’s a mechanical process to track down the remaining leaks and verify that none remain.
Success!
After tracking down the remaining leaks and adding some runloop spinning at tearDown, the runloop is clear and the tests are 28% faster. Although it took a considerable amount of time to debug, hopefully this time lost is repaid in the future via shorter, stabler test runs–not to mention we got a blog post out of it.
Thanks to Kyle Van Essen, Eric Muller, Justin Martin for their assistance! Alan Fineberg - Profile *Debt: The First 5000 Years made a big impression on me so I eagerly scooped up The Utopia of Rules by David Graeber. It…*medium.com
Authored By


