Ember and D3: Building responsive analytics
How we bult our web analytics panel with Ember and D3.
Written by Allen Cheung.
A few months back, as we sat down to think about how Square was going to transform the over-the-counter experience with Register 1.0, we also realized that we wanted to augment our users’ understanding of their own businesses with more analytics. We wanted our merchants to have even more visibility into their Square transactions, and be able to surface actionable metrics on the performance of their businesses through serendipitous discovery and interaction.
In other words, we were determined to build the best user experience for our merchants, with a responsive and intuitive interface, on top of giant piles of payments data. In a web browser.
Here’s how we did it.
Focus on Real User Questions

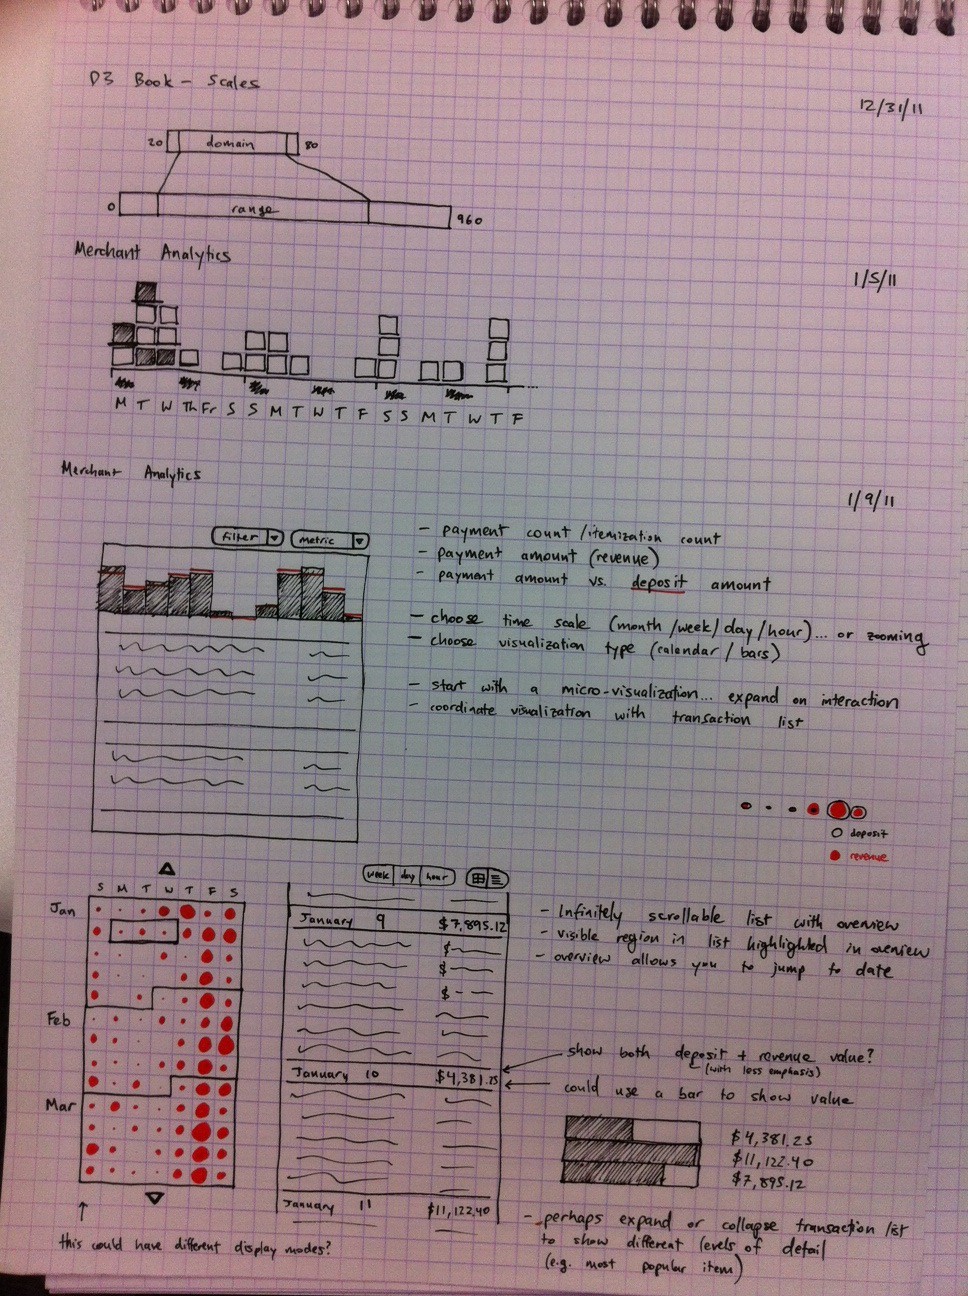
Asking users is a really good way of invalidating preexisting perceptions, and we started off by translating what we thought our users wanted into what they showed us they needed. We approached several merchants, analyzed their business data and presented our most interesting insights: performance over time turned out to be an important visualization, but between unspoken words were underlying questions, such as,
-
“When should I be open?”
-
“Which days are my most successful?”
We had to address the basics, but the bigger challenge was to provide explorative analytics to answer these questions. Through more research and prototyping, we arrived at a construct for analytics that was universally applicable: payment counts by calendar date, day of the week, hour, and amount. As interaction and discovery remained top priority, we threw in a requirement to filter the groupings in real-time.
Ember.js and D3.js — D3mber?
Ember.js is the backbone of our new analytics page, while D3.js — to continue the tortured analogy — is the muscle powering our visualizations. Ember makes coordinating data across multiple views and embedded model objects scarily easy, and we’re starting to see major gains in the testability of our codebase from enforcing Ember’s Model-View-Controller structure in the Javascript we’re writing. The Jasminetest suite runs fast, continously integrates, and completely skews our build stats.
So while Ember manages the page at a macro level, D3 handles rendering at the micro level. Between its scaling functions, axes rendering, and advanced brushing and selection implementation, the library is responsible for coercing our payments data into charts and tables. Our code ended up being an in-house blend of D3 functions within Ember controllers and Handlebars templates.
For example, to render bar charts, we define in the BarChart template:
<path id="{|unbound guid|}-bars"
    {|bindAttr d="barsPath"|}
    clip-path="url(#{|unbound guid|}-bars-clip)"
    transform="translate(0,1) translate(1,2)" />
The d attribute in the SVG path element defines the shape of the bars, and is bound to a memoized calculation (i.e., computed property) by Ember in the associated BarChart view:
barsPath**:** **function**() {
  *// Deal with subpixel rendering inconsistencies between Firefox, Safari, and Chrome:*
  *// -0.5 on width as Firefox sticks the bars out to the next pixel*
  *// this lets FF have the whole number, while Webkit rounds up (e.g., 4.5 -> 5)*
  **var** data **=** **this**.get('data'),
      width **=** **this**.get('barWidth') **-** 0.5,
      x **=** **this**.get('xScale'),
      y **=** **this**.get('yScale'),
      *// dummy sub-path to prevent svg rendering errors when data is empty*
      path **=** ['M0,0'],
      d;
  **for** (**var** i **=** 0; i **<** data.length; i**++**) {
    d **=** data[i];
    path.push('M', x(d.key), ',', y(0), 'V', y(d.value), 'h', width, 'V', y(0));
  }
  **return** path.join('');
}.property('data', 'barWidth', 'xScale', 'yScale').cacheable()
xScale and yScale are D3’s time-based scaling functions, and are exposed here as Ember computed properties:
xScale**:** **function**() {
  **return** d3.time.scale().interpolate(d3.interpolateRound).clamp(**true**);
}.property().cacheable()
Turbo-charged
 Performance you can put a face to.
Querying, sending, and manipulating tens of thousands of payments is a pretty intensive task. For the sake of responsiveness, we ended up sending down all of a user’s payments to the browser; of course, this made both our servers and our Javascript code rather unhappy.
On the server-side, ActiveRecord took up too much memory and too much time trying #to_json all of the Payment objects. We saw the underlying database got hammered with joins for associated metadata, and the default JSON serializer was quickly overrun with the amount of information it needed to parse. After some ineffective tweaking, we took more drastic measures:
-
Changed up the encoder to Yajl, which gave us streaming JSON encoding with a tiny memory footprint,
-
Broke the downstream data to discrete chunks, instead of everything at once,
-
Retrieved payments metadata on-demand from user interactions, essentially re-joining them with already-downloaded Payment objects in the browser.
Once in the browser, our set of payments needed to be filtered, in real-time, in response to new selections dragged by the user. Crossfilter is the library we wrote to support fast multi-dimensional filtering; each mousemove event triggered different filter updates to five other “charts” (as the summary table and payments list also needed updates in real time, they in effect became charts) on the page. We also spent some time tweaking our CSS,DOM structure, and animations to keep the page response near-instant, even for our biggest merchants: in two weeks, we optimized our performance by two orders of magnitude!
Analytics, v1
We learned a ton building this product, and we really enjoyed pushing the envelope in how analytics looks and behaves on the web (or really anywhere). We also love that we’re able to build upon the latest open source technologies, and in the process wrote and released some of our own as well. Our merchants have been very enthusiastic and appreciative about this release, and we’re already having conversations about what we can do next and what kind of data will make our users even more excited.
It’s pretty sweet.


