Autoscaling based on request queuing
Modern web development often includes traffic-heavy web applications and APIs. These services are tasked with a double-whammy: they need to…
Modern web development often includes traffic-heavy web applications and APIs. These services are tasked with a double-whammy: they need to be able to do a ton of work and to be able to do it for a significant number of requests. For example, a single application can be responsible for user authentication, request routing, view rendering (both HTML and JSON), business logic, and accessing data from a permanent data store [1]. Being able to do that and respond to high levels of load is a big ask. Applications attempting to do both do not scale well on their own and, as an industry, we’ve found some ways to solve this challenge.
The tool that we reach for first is to solve them problem through hardware. At relatively small scale, adding more resources to the server that is doing the work (i.e. adding more CPU, RAM, or disk space) is cheaper than scaling horizontally (which we will talk about in a moment). This can be called “scaling vertically” or going “Big Iron”. This was the way the Caviar first solved our scaling problem (and we still do for certain applications, actually).
Scaling this way is a two-phase attack on the problem by 1) adding more resources or 2) using those resources more effectively. Using the resources more effectively means to not actually change the amount of resources on the machine, but to use techniques such as threading and parallelization to get the most of them. This can also mean switching to other models of use.. for example using event-based programs instead of having e.g. I/O block use of threads and, ultimately, the underlying resources. Eventually, though, you run out of room to optimize and you need to add hardware. Adding better, faster, more spacious hardware can only take you so far, though. At some point, hardware becomes more and more expensive as the demands required go beyond the capabilities of commodity hardware.
An alternative is to use horizontal scaling. Instead of adding CPU, RAM, and disk space to a single server, we add more servers. These servers are typically equipped with mid-range commodity hardware and are extremely cost effective. With this fleet of servers, you place your same service on two or more of them and distribute requests across each server. There are a few implications here. First is that all state must be stored in a centralized data store, like a database [2]. Second is that you can effectively scale to infinite size on this setup, adding as many commodity hardware servers as you need.
One of the great upsides of the rise of cloud computing is that they are very good at horizontal scaling. Almost by default, modern web applications use centralized data stores provided by these cloud services. Cloud service providers like Amazon and Google have created load balancing appliances that distribute requests. Those load balancers handle some of the difficult, non-obvious hurdles that come up like service registration, health checks, and connection draining. Cloud computing providers can add or remove resources in minutes. This allows us to scale up to our customer demands very quickly and it allows us to stop using resources as we need less and less of them.
Putting horizontal scaling into practice comes in many flavors and one of the easiest approaches to start is to over provision. We achieve this by finding the peak usage of our services and, at the very least, scale our number of servers up to the size that would enable them to handle that amount of load. This can have some challenges. Caviar, for example, experiences asymmetric load over the course of the day. As you can imagine, for a food ordering service, lunch and dinner are our peak times. Here is the load profile from one of our services, which has stayed remarkably similar over the past 3 years.
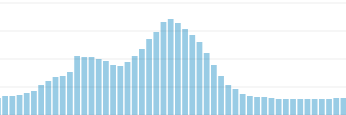
As you can see by just counting the horizontal grid lines, our peak load is about 5x our minimum load for this particular service (seen near the edges). This means that for all the time that is not peak load, there are resources just sitting idle. This is both wasteful and brittle. If you have a special promotion, your provisioning may not be adequate and you’ll have to increase your resources. If you don’t anticipate this perfectly, you run the risk of overloading your systems and having the site go down due to load.
The alternative is to scale with your load. This solves both problems experienced in the over provision scenario. First, your system is dynamic and responding to change all the time, so an unexpected increase in load should be handled no problem. Second, you can match your resource provisioning profile to your load profile, and save time and money on those resources. But, you need to make a decision regarding how to autoscale your services. There is not a bunch of information out there on different approaches to this, but I’ll talk about two examples and Caviar’s experience with each.
The first approach we used at Caviar and the one I had used previously was to use the response time of the service as the indicator of the load profile of the service. We used this while we had a single monolithic Rails service that had hundreds of different endpoints each with different expected response times. This method gave us low visibility into the true health of our service. If we were backing up on our fast API endpoints that were calling us all the time, it would often be masked by higher response time endpoints that were called less frequently. It made scaling unpredictable and did not achieve our ultimate goal of having enough resources to serve each user request in a timely manner.
We switched to another method using request queuing. There is a bit of nuance here and we evolved our approach over time, so I’ll explain the differences between each of the ways we approached them and where we are at today. We’ve tried to different methods of measuring request queuing and have landed on a system that we think functions pretty well.
We started by using a rough approximation of request queuing by calculating the amount of time that it took to get from the load balancer (in this case, it was Amazon’s ELB) to the first part of the Rack stack. Since ELB does not provide a timestamp header added to the request (which you can do in e.g. nginx), we needed to calculate it via reported metrics from the ELB and from Rack for each individual request. This was better than use response time because it gave us insight into how much time each request was waiting for the server to become available to service a new request. This would happen on each endpoint and we could measure the approximate request queuing time across all endpoints independent of their ultimate response time. The downside of this was that it was both a little unreliable (difficult to perfectly match everything so we were potentially missing data or incorrectly reporting data) and it was dependent on other variables like the network stack. The network stack added a relatively stable, but not always predictable, overhead cost to our calculations. So, our request queuing metric would never fall to a flat 0 because it always takes some time for the ELB to process a request, offload SSL if it needed to, and route the request to the server waiting for the request. Generally, we could work around that, but we found another way to solve the problem.
We realized that what we were really wanting to know is if there was anything queuing up at our Rails application. We use puma as our web application server and it has a bunch of advantages that we can go into another time, but one of the things is that is allows us to inspect the queue length at any given time. At startup, we start a new thread that will report statistics on a looping basis up to our metric collector (CloudWatch in our case). Every 30 seconds, we query the puma master process to fetch the stats for each working, including the number of working threads and the current backlog (queue) count. We report those metrics to our metric collector. We then aggregate the queue across all of the running services to get an idea of how backed up we are. If we are backed up for a sustained period of time, we add services to clear that queue. If we are clear for a longer period of time, we remove services from the stack (down to some minimum, we always have at least 3 for redundancy). This system allows us to respond both quicker and with a great deal of clarity to our production load. In addition, the same scaling system works exactly the same for background workers. Instead of using puma queues, we use Sidekiq queues and scale on similar parameters.
There are still improvements to be made to this system, but today we’re pretty happy with the overall setup. The main issue that we have with this setup is that with queuing being the only metric we use to respond to autoscaling up and down, there is no “steady state” and we’re constantly under/over provisioning and changing the number of services that we are running. We will continue to tweak the system in order to find the right balance of tradeoffs for us going into the future.
Overall, using request queuing as the input to our service scaling has gotten us to a place where we feel confident in our ability to respond to change. We’ve been running with some form of autoscaling based on request queuing for over a year the effort was far and away worth it. On a final note, I wanted to drop a sample GitHub repository that had a puma web server that reported metrics up to AWS CloudWatch as a starting point. Once you get there, it is all about creating alarms and autoscaling, which I’ve including some example CloudFormation templates for how to do that part. In the end, if you have a large scale [3] web system that needs to respond to variable traffic, autoscaling based on request queues is what I would recommend.
[1] There are other interesting architectural methods of reducing the load instead of leaning on the server to do so much work. This includes single page applications (SPAs) and statically pre-generated websites. I’m interested in exploring those topics later, but for this post we’re going to focus on more classic web applications.
[2] This actually isn’t usually a problem. Most modern web stacks start off with a database backing them as part of the bootstrapping step. Other things to consider are caching, uploaded files, etc. Caching can be offloaded to a caching store like memcached and files can be stored on a file repository like S3.
[3] I cannot/will not speak to “global scale.” In theory, these techniques work, but I’ve never tested it in those environments.
