Application visibility
A sneak peek into various monitoring and alerting systems used at Square.
Written by Syam Puranam.
Background
Square has experienced tremendous growth over the past five years. Our technology stack evolved from a handful of monolithic rails applications to a microservices architecture. The change and growth in our services brought new challenges for application visibility. In today’s blog post, we will review a few guiding principles and provide a sneak peak into various technologies we are using to monitor and visualize our diverse service ecosystem. We will be open sourcing various parts of our service monitoring and visualization stack, starting today!
Principles
Few of our guiding principles are:
-
Focus early and often on usability. With a microservices architecture, it is very easy to collect massive amounts of signals. A good user interface is essential to extract meaning from the signals.
-
Identify and surface the most important aspects of your metrics. We are guided by the idea that humans can effectively work with very few items at a time. So, any question about metrics should be answered within a few tries. For example:
-
Top-N API metrics sorted by latency or changed week-over-week.
-
Automated problem detection. The inspect utility surfaces obvious issues for systems troubleshooting.
-
Applications should have good default coverage for metrics from day one. We ensure good instrumentation in our standard application containers and our typical dashboards include metrics for:
-
Databases
-
Hosts and containers
-
Performance metrics around each HTTP/REST endpoint
-
VM statistics for any JVM used to run service components
-
Alerting needs to be simple and relevant. We track a lot of metrics around alerting to improve our on-call experience with the goal of reaching zero unactionable alerts.
-
Alerts should be urgent and immediately actionable.
-
Alerting should be an unusual event.
-
Every alert should require human intelligence to deal with.
-
Every alert should be reproducible.
Applications
Some of the applications we use at Square to follow these principles include:
-
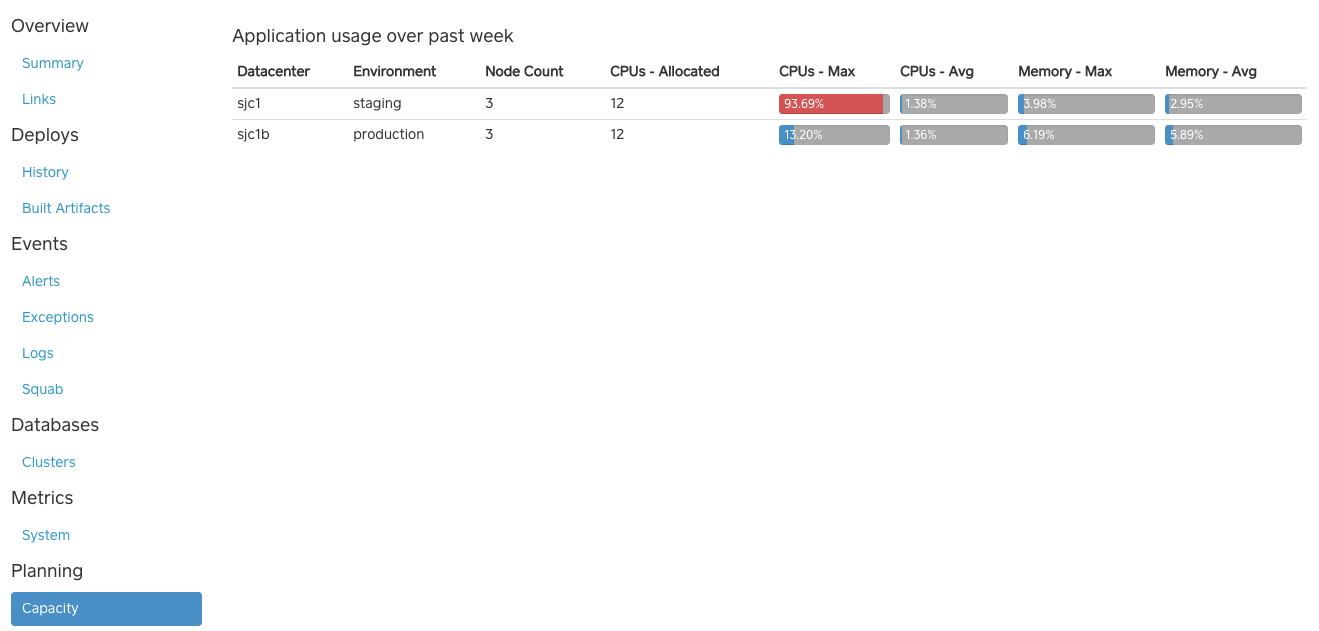
Appdash The one place to get quick information about your application, including:
-
Deployment information, like which hosts are running what releases, which releases are available, etc.
-
Application dependency geometry
-
Events and exceptions from your applications
-
Capacity modeling

- MetricsDashboard View metrics across all platform and applications. Here is an example of a dashboard for the database behind metricsdashboard UI.

- Presidio A log-search application based on Elasticsearch. It provides application developers an easy interface to find patterns that may reveal errors or to help trace an event through multiple services.

- Equilibrium Our next generation alerting system that is quickly replacing our Nagios infrastructure. Equilibrium brings considerable ease-of-use and improves reliability and scalability. It is influenced by our experience working with Nagios, as well as modern trends in open source (like Sensu), and what we’ve seen work at scale for other companies.

Today, we are open sourcing one of our smaller — but important — projects in our ecosystem: inspect. inspect is a collection of libraries that we use to collect Linux, MySQL, and PostgreSQL metrics. The project also includes a command line utility for Linux that can perform basic problem detection.

Conclusion
We hope you will find inspect helpful and that this blog post provided a sneak peek into various monitoring and alerting systems used at Square. We will be covering each of these systems in detail in subsequent blog posts. As always, please tune into The Corner for further updates!

