
Always Be Closing
The Tale of a Go Resource Leak
This is the story of a resource leak in one of Square’s Go services and the process of uncovering the root cause. Facing spiky and mysterious system metrics, we used a variety of standard and homemade tools to uncover a subtle bug in one of our core internal frameworks.
Earlier this year, one of our Go services began using significantly more memory, breaking out of a steady state of flat memory use and predictable garbage collection patterns. At the same time, CPU use rose as well. This particular service has generally used around 200 MB of memory, but this figure soon grew to be several GB.
After much investigation, it turned out that for a substantial number of requests, a combination of bugs was causing the service to retain per-request metadata for almost 17 hours instead of a few milliseconds. Ultimately, there were two root causes, both of which were tickled by a seemingly benign configuration bug in another service. While only one service was affected, many of our other Go services were potentially susceptible to this bug.
This post first explains the bug we encountered then recounts the various steps we took to investigate, some of which were more fruitful than others.
Root Cause and Lessons Learned
Ultimately, the root cause was due to incorrect uses of Go’s [Context](https://golang.org/pkg/context/#Context) type. At Square, we have a custom framework for handling incoming requests and dispatching to handler functions. This framework code was creating Contexts with deadlines but, after the request was completed, not canceling the Contexts to release related resources. This resulted in the lifetime of each Context object on the heap exceeding that of its related request.
This root cause was tickled by a configuration change in another service, which inadvertently set its client request timeout to 60,000 seconds instead of the intended 60,000 milliseconds. This client misconfiguration led to each of its requests having their Contexts retained by the buggy server for 60,000 seconds (16.7 hours) instead of a few milliseconds.
Go’s Context: A Quick Primer
In Go, Context is an interface used as a general way of passing around immutable metadata for a single request or operation.
A Context is created with a key-value pair and can be wrapped by another Context to add or override data. The outer/wrapping/child Context has access to its wrapped/parent Context's data but not vice versa.
Here’s a quick example of how Context's are created:
rootCtx := context.Background() // Returns a singleton

// a is a child of rootCtx
a := context.WithValue(rootCtx, "location", "San Francisco")

// b is a child of a
b := context.WithValue(a, "weather", "foggy")

// c is also a child of a and is unrelated to b
c := context.WithValue(a, "weather", "cloudy")

// d is a child of c and overrides c's "weather" value
d := context.WithValue(c, "weather", "sunny")

fmt.Printf("location=%v weather=%v\n",
    a.Value("location"), a.Value("weather"))
fmt.Printf("location=%v weather=%v\n",
    b.Value("location"), b.Value("weather"))
fmt.Printf("location=%v weather=%v\n",
    c.Value("location"), c.Value("weather"))
fmt.Printf("location=%v weather=%v\n",
    d.Value("location"), d.Value("weather"))

// Output:
location=San Francisco weather=<nil>
location=San Francisco weather=foggy
location=San Francisco weather=cloudy
location=San Francisco weather=sunny
The relationships between the Contexts in the example look like this:
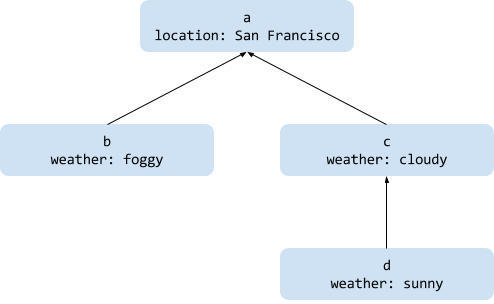 Contexts point to a parent, inheriting or overriding values.
In addition to storing key-value data, Context's may also be created with associated wall-clock deadlines. When a Context with a deadline is created, it registers a callback function that marks the context as canceled after the deadline passes. This callback function is scheduled by Go runtime internals.
// context.WithTimeout schedules a timer to cancel the context.
// The deadline for ctx will be the 5 seconds from the current
// wall clock time.
ctx, cancelCtx := context.WithTimeout(
    context.Background(), 5*time.Second)
defer cancelCtx()

// ... some amount of time passes ...

if ctx.Err() == nil {
    fmt.Println("The context is not done yet.")
    // ... do work ...
} else {
    // The context either timed out or cancelCtx() was called.
    fmt.Println("The context is done. Skipping work.")
}
Critically, the timer’s callback function keeps a reference to the Context to be canceled. If application code does not explicitly cancel the Context, the runtime timer remains set and the Context remains in memory until the timer fires.
This was our core issue: some of our framework code was not explicitly canceling the Context's it was creating and passing to handler code.
To illustrate, framework code was essentially doing this:
func (s *Server) handleRequest(req *Request, conn *Connection) {
    // Create a context with a deadline an hour in the future.
    ctx, _ := context.WithTimeout(context.Background(), 1*time.Hour)

    // Attach metadata to the ctx using a helper function.
    ctx = s.contextWithMetadata(ctx, req)

    // Deserialize the request and delegate to a handler.
    reqProto := deserialize(req)
    if respProto, err := s.callHandler(ctx, reqProto); err != nil {
        conn.WriteError(err)
    } else {
        conn.WriteResponse(respProto)
    }

    // Even though this method returns quickly, ctx is retained
    // in memory for an hour since the pending deadline timer holds
    // a reference to it. Only after the timer fires can the ctx
    // be garbage collected.
}
The correct way to use Context's is to always cancel them when the the related operation — the request handler, in our case — completes. As a rule of thumb, any code that creates a new Context should ensure that it is canceled.
Given the buggy snippet above, the actual code fix is simple:
func (s *Server) handleRequest(req *Request, conn *Connection) {
    // Create a context with a deadline an hour in the future.
    ctx, cancelCtx :=
        context.WithTimeout(context.Background(), 1*time.Hour)
    // Use defer in case of panics or returning early.
    defer cancelCtx()

    // ... The rest of the method is the same ...

    // Right after this method returns, cancelCtx() is called,
    // allowing ctx to be garbage collected.
}
Bonus reading: The
Contextimplementation uses[timer.AfterFunc](https://golang.org/pkg/time/#AfterFunc) to schedule the deadline timer, and the[timer.(*Timer).Stop](https://golang.org/pkg/time/#Timer.Stop) method to cleanup that timer when theContextis canceled. Take a peek at the context.go source code to see how the timer is created and used.
Internally, the Go runtime uses a heap to manage all outstanding timers. See the runtime/time.go source code for its implementation.
Lessons Learned
Always rollback when possible. This was less a lesson learned than a maxim ignored. When we started investigating this issue, one of the first things we did was look for other changes that were happening around the same time that the performance degraded. While a few interesting changes had occurred within a few days, the change to the client timeout configuration had a very good correlation in terms of timing. Despite several engineers reviewing the configuration changes as part of its initial review and again during this investigation, everyone dismissed them as irrelevant (“we’re just bumping the timeout a little bit — no big deal!”).
Given the close timing between the change and the incident, as well as the very low cost of rolling back the client configuration change, we should have immediately rolled back the timeout change. This would not have fixed the root cause but would have helped pinpoint where to investigate further.
Gaps in Go tooling made investigating difficult. Debugging this issue was hampered by a notable gap in Go tooling that we would not have faced were our code running on the JVM. All signs pointed to this issue being a fairly classic memory leak but Go does not really have tooling to dump and analyze heaps. While the pprof tool can be useful to find some memory issues, and did give some useful hints in this case, it is limited: it gives statistics on where objects are allocated but not what is retaining them.
The Investigation
The remainder of this post goes through the investigation in roughly chronological order, with some commentary around observations that were, in hindsight, wrong or misleading.
The general progression went as follows.
-
Look for correlating code and environment changes to the affected systems, its related systems, and hardware.
-
Dig into GC logs.
-
Profile the heap using pprof.
-
Attempt a deeper heap analysis using runtime heap dump methods and homegrown tools.
-
Experiment with different patches on canary hosts, using runtime GC hooks to narrow down which objects were being retained.
-
Fix!
The fourth and fifth steps required the most hacking but were ultimately the most fruitful.
Step 1: Looking For Correlating Changes
First, we made a list of observed changes:
-
Sudden climb in memory use, from under 200 MB to 3–6 GB.
-
Memory use climbed consistently but seemed to plateau. The process was not running out of memory and being killed by the OS. In hindsight this makes a lot of sense, since the leaked objects were eventually being GCed when their
Contextcleanup timers fired after 17 hours. -
Previously predictable GC run rate dropped significantly.
-
Consistently higher CPU usage.
We also made a list of what didn’t change:
-
There was not a spike in requests to the service.
-
There were no recent deploys of the service.
-
No correlating deploys of services that are dependencies.
-
No correlating deploys of calling services. This observation was incorrect, as the client timeout change ended up correlating.
Step 2: Digging into GC Logs
Since we saw alarming GC patterns, we decided start by looking through GC logs to find any odd behavior. The main takeaway from reading these logs was that despite our heap continually growing, garbage collection was not taking an outsize amount of time; each GC run was short and released only small amounts of memory.
Aside from that, this step was a useful exercise in better understanding Go’s GC log format, so let’s take a look at a snippet of what we encountered:
GC forced

gc 848 @78217.082s 0%: 0.050+6819+3.3 ms clock, 0.10+0/3412/9164+6.6 ms cpu, 2474->2504->1908 MB, 3818 MB goal, 2 P
Here’s how to interpret the components of the first gc line:
-
848: It was the 848th garbage collection since the process started. -
78217.082s: The process had been running for 78217.082 seconds at that point. -
0%. Roughly 0% of the process’s total time had been spent in GC. -
0.050+6819+3.3 ms clock, 0.10+0/3412/9164+6.6 ms cpu: The time spend in each of the three GC phases: stop-the-world sweep, concurrent mark and scan, and stop-the-world mark termination. -
2474->2504->1908 MB: The heap sizes before GC and after GC, and the live heap size. Go overallocates heap, so in this case only 1908 MB of the allocated 2504 MB of heap was used by Go objects. -
3818 MB goal: The heap size at which the garbage collector will start the next run. This is determined by the heap size after the current GC run and the[GOGC](https://golang.org/pkg/runtime/#hdr-Environment_Variables) environment variable, which has a default value of 100 and represents the ratio of newly allocated data to existing data since the last GC. The calculation behind the goal in this case: 1908 MB + (1908 MB *GOGC/ 100) ≈ 3818 MB. -
2: number of processors used by the garbage collector.
There were also some additional logs from the garbage collector’s scavenger:
scvg521: 0 MB released

scvg521: inuse: 2543, idle: 339, sys: 2883, released: 186, consumed: 2696 (MB)
The scavenger releases unused memory back to the system, truly freeing memory.
Let’s interpret the scavenger output:
-
0 MB released: No memory was returned to the system. -
inuse: 2543: Go has allocated 2543 MB of memory for its heap, which may include unused memory and dead objects. -
idle: 339: 339 MB of memory that used to contain reachable objects but not longer does. -
sys: 2883: 2883 MB have been requested from the OS. -
released: 186: 186 MB of memory has been released back to the OS. -
consumed: 2696: 2696 MB has been allocated to Go by the OS.
Step 3: Profiling the Heap with pprof
With evidence of a memory leak, we decided to use pprof to narrow down which code was leaking memory. Pprof is a standard Go tool for dumping, exploring, and visualizing statistics about memory and CPU use of Go apps. With pprof, you can either analyze a single dump or the diff between two different dumps. That latter is useful for finding changes after an application is running in a steady state.
Our Go applications have internal HTTP endpoints to retrieve data for pprof, so we used that to get a dump of a running process:
curl -sk [https://our-service:12345/debug/pprof/hea](https://our-service:12345/debug/pprof/head)p > heap.out
Once we had a dump, we were able to use pprof to show which methods were allocating the most data. Here’s one of the commands we ran, which displays the functions allocating the most unreleased memory.
# pprof takes both the binary of the app (service_binary in this
# case) and the dump (heap.out) as arguments.
go tool pprof -runtime --inuse_space service_binary heap.out


(pprof) top

1473.20MB of 1884.53MB total (78.17%)

Dropped 1264 nodes (cum <= 9.42MB)

Showing top 10 nodes out of 77 (cum >= 73.50MB)

flat  flat%   sum%        cum   cum%
286.02MB 15.18% 15.18%   561.10MB 29.77%  context.WithDeadline
242.57MB 12.87% 28.05%   524.09MB 27.81%  square/up/xp/sakeutil.NewClientContextWithTimeout
224.52MB 11.91% 39.96%   224.52MB 11.91%  square/up/tracing.appendTiming
152.01MB  8.07% 48.03%   152.01MB  8.07%  runtime.rawstringtmp
128.54MB  6.82% 54.85%  1444.29MB 76.64%  square/up/sake/server.(*Server).handleRequest
122.02MB  6.47% 61.32%   122.02MB  6.47%  square/up/vendor/stash.corp.squareup.com/go/protobuf.git/proto.(*Buffer).DecodeRawBytes
85.51MB  4.54% 65.86%    87.07MB  4.62%  runtime.mapassign1
80MB     4.25% 70.11%    93.56MB  4.96%  time.AfterFunc
78.51MB  4.17% 74.27%   182.02MB  9.66%  context.WithCancel
73.50MB  3.90% 78.17%    73.50MB  3.90%  context.WithValue
Each of these lines indicates how much memory was used by objects created inside a specific function. It’s important to note, though, that this only indicates where objects were created, not what is still retaining references to them.
Looking closer, the method that handles all incoming requests is responsible for lots of retained objects, at least indirectly:
128.54MB 6.82% 54.85% 1444.29MB 76.64% square/up/sake/server.(*Server).handleRequest
This line indicates that handleRequest created 128 MB (6.82% of the heap) of objects that are still reachable. Furthermore, handleRequest plus methods reachable from it are holding on to 1.4 GB of objects. In a normal state, both of these numbers would be a few dozen MB at most.
When we first saw this data, we correctly assumed that request handling code was leaking objects. We also noticed that despite lots of Context objects being retained, the request messages were not being retained. However, we still did not understand the root cause at this point. In hindsight, we could also have noted that 94 MB of memory allocated inside time.AfterFunc is unusual and explored that further.
Step 4: Heap Dump Analysis
At this point, we decided to go off the beaten path.
While pprof gave us hints that request Context data was leaking, it didn’t pinpoint the cause of the leak and what was holding on to them. Many languages have tools to dump an application’s heap and analyze and traverse the object graph — if this were a Java app, we would have happily fired up the Eclipse Memory Analyzer, for example. Unfortunately, Go is not one of those languages.
Rich heap dump support is incredibly useful. It makes it much easier to find why an object is not being garbage collected by traversing the path from a retained object to a root object. In this case, we wanted to find a data structure holding on to tons of request-related data and I suspect having a real heap analyzer tool would have drastically cut down the time it took us to debug.
While Go doesn’t have support for exploring heaps, it does have an unofficial method in the runtime/debug package for generating something approximately like a heap dump: [debug.WriteHeapDump](https://golang.org/pkg/runtime/debug/#WriteHeapDump). This function outputs some low-level heap state of a running process in binary format. The Golang wiki has incomplete documentation of the format so we ended up having to read the WriteHeapDump source code in order to understand it.
There is an enormous downside to the output of WriteHeapDump: it essentially dumps the raw bytes of each object along with a bit set indicating which words within those bytes represent pointers to other objects. It omits any data about the type, including the type’s name.
Traversing an object graph without types was a tedious at best and impossible in most cases. We found that finding obvious strings and working backwards through referring objects was the only way to infer object types. Even this required knowing how Go represents core data structures, like slices and maps, in memory.
Aside: The Go maintainers have been involved in discussions around building proper support for heap analysis, so hopefully tooling will be better somewhat soon. This request and this related discussion have some context.
Here’s what a dumped object looks like. Each field line below represents a word of memory, and some link to other objects when a word represents a pointer.
A visual representation of a heap dump object, courtesy of heapdump14. This represents a struct of a specific Protocol Buffer message but determining that was a chore.
The image above is from an open source project, heapdump14, which was written circa Go 1.4. Older Go runtimes included more detailed type information in the heap but the amount of available metadata has been reduced as the runtime has evolved in newer versions of Go. We decided to try and use this tool to better understand a heap object graph; getting it running required applying this patch to the tool’s source and then writing an additional patch of our own.
After traversing the graph as viewed through heapdump14, we determined that the object in the image above was an instance of a type that looks like this:
type SomeProtoMessage struct {
    FirstField       *string
    SomeBytes        []byte
    XXX_unrecognized []byte
}
“64_PPSSP” in the image is heapdump14’s name for the type. The number is randomly chosen by the tool but is unique to the type. PPSSP indicates the types of each word in the object: [pointer, pointer, scalar, scalar, pointer]. Per the image above, the object is 7 words, where each field row represents a word. This is not the 5 suggested by PPSSP; it’s unclear how this name was formed or why the dumped type has 7 words instead of the expected 3 (one for the pointer and two for the slices).
Failed tangent: We tried to write a tool that traverses all types reachable from the entry point of our app and, for each type, print out a heapdump14-compatible type signature. We were unable to do this successfully in a reasonable amount of time and abandoned the effort. On the bright side, we learned a bit about how to use the standard library to inspect a Go program’s source at various phases of parsing.
Step 4 1/2: Not All Is Lost
While traversing the heap was ultimately a failure, the effort was not a total bust. We noticed that strings in the heap were useful hints of some types being retained — especially useful in our case, since requests to the server contain lots of strings.
With this in mind, we wrote a simple tool to extract counts of common strings in the heap. It also counts strings in the distinct format that Square’s RPC framework uses to represent request IDs.
The following sample of the output indicates that much of the retained data was related to requests from a single service — the one with the misconfigured timeout.
The first line of output show the count of request IDs in the heap — indicating how many requests have some related data still in memory.
The remaining lines first output a count, then (p) if the count is for a string encoded in a protocol buffer message, and finally the string itself, surrounded by backticks. For example, 995090 (p) application/x-protobuf``, means that the protocol buffer string application/x-protobuf appears in the heap 995,090 times.
# Each request has a unique string ID in a uniform format.
# The following count shows lots of request ID strings in the heap.
Request ID counts: 1492947

# The format of each following line is:
# count [(p) if protocol buffer string] `string in heap`

995090 (p)     `application/x-protobuf`

# Although the service has many different callers, only the name of
# the service with the misconfigured timeout shows up a lot.
497548         `the-misconfigured-calling-service`
497545 (p)     `Content-Length`
497545 (p)     `Accept`

# The bad timeout value included in requests.
497545 (p)     `60000`

497545 (p)     `X-Request-Deadline`
In hindsight, we really should have rolled back the offending calling service at this point, but unfortunately we did not.
Step 5: Experimenting with Finalizers
At this point, the mystery we were intent on solving was why only requests from a specific service were causing leaks. We used some hacky Go runtime tricks to help and finally figured it all out.
To determine characteristics of specific objects being retained, we turned to Go’s [runtime.SetFinalizer](https://golang.org/pkg/runtime/#SetFinalizer) function. This function instructs the Go runtime to execute a callback immediately prior to garbage collecting an object. Setting up the callback is easy, although I would not recommend using it in real production code:
heapObject := new(string)

runtime.SetFinalizer(heapObject, func(theObject *string) {
    // heapObject/theObject is about to be garbage collected.
    fmt.Println("bye!")
})
With SetFinalizer in mind, we set finalizers for a small set of types and had our server occasionally log counts of each types created and garbage collected. The code to track Contexts looked roughly like this:
var (
    contextNumber       int64
    contextsOutstanding int64
)

func requestHandler(...) {
    ctx, _ := context_helper.NewContext(timeout)

    // To help debug, use a counter to link allocation and
    // and finalizer log messages.
    ctxNumber := atomic.AddInt64(&contextNumber, 1)

    // Keep a count of reachable Context objects.
    ctxOutstanding := atomic.AddInt64(&contextsOutstanding, 1)

    glog.Infof("gc-investigation: action=alloc type=Context " +
       "id=%d outstanding=%d",
       ctxNumber, ctxOutstanding)

    runtime.SetFinalizer(ctx, func(r context.Context) {
        ctxOutstanding := atomic.AddInt64(&contextsOutstanding, -1)
        glog.Infof("gc-investigation: action=finalize " +
            "type=Context id=%d outstanding=%d",
            ctxNumber, ctxOutstanding)
    })

    // ...
}
The output of this logging unambiguously showed that someContexts were not being GCed but that request objects were. The counts of outstanding Contexts kept rising. In the snippet below, of the 162,573 Contexts allocated during the life of the process, 4,920 remained in memory.
2017-04-21 23:42:21,919257 INFO [4] [server.go:635] gc-investigation: action=finalize type=Context id=162573 outstanding=4920
Putting It All Together
By this point, we knew that Contexts were leaking and where those Contexts were being created. We reread the Context documentation and scanned through its source code to get a better understanding of how it is implemented. This led us to seeing its use of time.AfterFunc and how that interacts with the runtime. We then formed a hypothesis that these timer callbacks were leaking. This was soon confirmed by a more thorough reading of the source code of our server framework.
In the end, the fix was an incredibly simple change to our request handler framework code:
// Before
func requestHandler(...) {
    ctx, _ := context_helper.NewContext(timeout)

    // ...
}

// After
func requestHandler(...) {
    ctx, cancelCtx := context_helper.NewContext(timeout)
    defer cancelCtx() // <-- Oops!

    // ...
}
This fixed the issue we witnessed in our misbehaving service. Since the framework is shared by other internal Go apps, the fix guards them against misbehaving clients as well.
Looking Back
Looking back on the whole ordeal reiterated the importance of a few key engineering practices.
One is that Go’s conventions around not ignoring returned errors and cleanup functions exist for good reason and should not be casually ignored. The original framework code should not have ignored the CancelFunc associated with Contexts given that the Context documentation clearly states that it releases resources. I would argue that any code swallowing cleanup and error return values is exceptional and should have a clearly documented rationale.
Another practice is to not hesitate to roll back code when it closely correlates to an issue in a related system. The cost to do so is very low but may yield the benefit of helping narrow down triggers of a bug. In this particular case, we would have saved significant time debugging.
Finally, debugging travails aside, we enjoyed learning more about various parts of Go’s internals and the tooling ecosystem around them.
Authored By
